Question
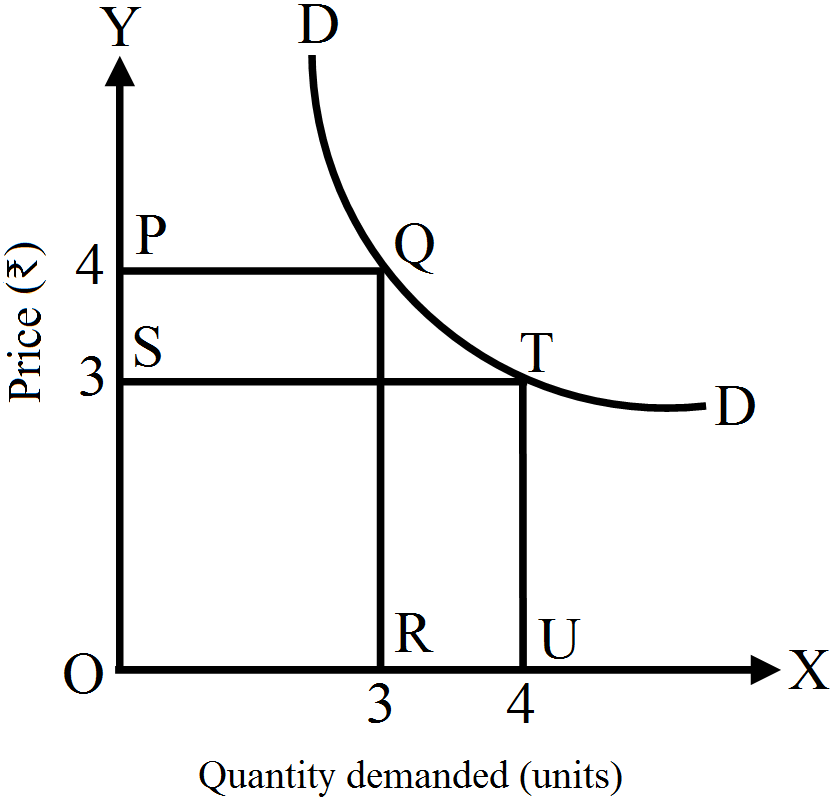
When does a demand curve take the shape of a rectangular hyperbola?

Answer

If the equation of a demand curve takes the form pq = e, where e is constant, irrespective of the values of p and q, then the demand curve that we get is a rectangular hyper- bola, implying that on each and every point on the curve, the area underlying is the same. In the graph depicted above, point Q on the demand curve corresponds to area enclosed by rectangle OPOR which is 12 units [OP × OR = 4 × 3] Also, point T on the demand curve corresponds to area enclosed by rectangle OSTU which is again 12 units (OS× OU = 3 × 4). Therefore, demand curve DD is a rectangular hyperbola.

Need a full question paper?

Generate a complete, print-ready paper with questions like this in minutes — across 16+ boards, with answer keys.

Start Generating Free

Similar questions

Given below is a cost and revenue schedule of a producer. At what level of output is the producer in equilibrium? Give reasons for your answer.
Output (Units) Price(₹) Total Cost(₹)
1 10 13
2 10 22
3 10 30
4 10 38
5 10 47
6 10 57
7 10 71
Giving reasons, state whether the following statements are true or false:
  1. When there are diminishing returns to a factor, total product always decreases.
  2. Total product will increase only when marginal product increases.
  3. When marginal revenue is zero, average revenue will be constant.
Market for a good is in equilibrium. There is decrease in supply for this good. Explain the chain of effects of this change. Use diagram.
OR
Explain the chain effects of decrease in supply of a good on its price, supply and demand.
Explain the inverse relationship between price and quantity demanded of a commodity.OR
Why is the demand curve of the commodity negatively sloped?
Explain the concepts of the short run and the long run.
Market of a commodity is in equilibrium. Demand for the commodity ‘increases’. Explain the chain of effects of this change till the market again reaches equilibrium. Use diagram.
A consumer consumes only two goods X and Y whose prices are ₹ 4 and ₹ 5 per unit respectively. If the consumer chooses a combination of the two goods with marginal utility of X equal to 5 and that of Y equal to 4, is the consumer in equilibrium? Give reasons. What will a rational consumer do in this situation? Use utility analysis.
Market for a good is in equilibrium. There is increase in supply for this goods. Explain the chain of effects of this change. Use diagram.
OR
How will equilibrium price and quantity be affected when there is increase in supply?
OR
Explain the chain effect of increase in supply of a good on its price, supply and demand. Use diagram.
OR
How does an increase in supply of a commodity affect its equilibrium price and equilibrium quantity? Explain with the help of a diagram.
OR
Market for a good is in equilibrium. Supply of the good 'increases'. Explain the chain of effects of this change.
Under what condition increase in demand would not make any effect on equilibrium quantity?
Explain producer's equilibrium with the help of a diagram.