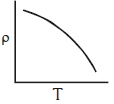
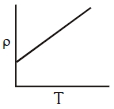
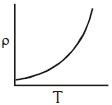
Which of the following graph represents the variation of resistivity ( $\rho$ ) with temperature $(T)$ for copper $?$
- A
- B
- C
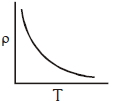
- D
NEET 2020, Medium


Download our appand get started for free
Experience the future of education. Simply download our apps or reach out to us for more information. Let's shape the future of learning together!No signup needed.*
Similar Questions
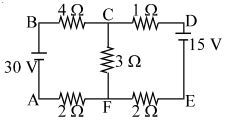
- 1The figure shows a network of five resistances and two batteries The current through the $30\,V$ battery is ............... $A$View Solution
- 2Equivalent resistance between the adjacent corners of a regular $n$-sided polygon of uniform wire of resistance $R$ would be:View Solution
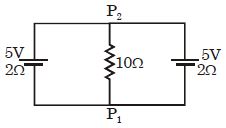
- 3Find the current in the $10\, \Omega$ resistanceView Solution
- 4$A$ current $I$ flows through a uniform wire of diameter $d$ when the mean electron drift velocity is $V$. The same current will flow through a wire of diameter $d/2$ made of the same material if the mean drift velocity of the electron is :View Solution
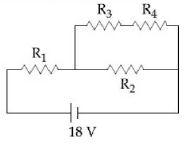
- 5In the given circuit the internal resistance of the $18\,V$ cell is negligible. If $R_1 = 400 \,\Omega ,\,R_3 = 100\,\Omega $ and $R_4 = 500\,\Omega $ and the reading of an ideal voltmeter across $R_4$ is $5\,V,$ then the value of $R_2$ will be ........... $\Omega$View Solution
- 6A $60\, watt$ bulb operates on $220\,V$ supply. The current flowing through the bulb isView Solution
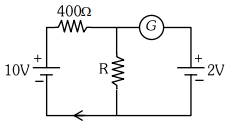
- 7If the galvanometer $G$ does not show any deflection in the circuit shown, the value of $R$ is given by $............\Omega$View Solution
- 8A copper wire of resistance $R$ is cut into ten parts of equal length. Two pieces each are joined in series and then five such combinations are joined in parallel. The new combination will have a resistanceView Solution
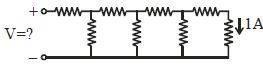
- 9Each element in the finite chain of resistors shown in the figure is $1\,\Omega $. A current of $1\, A$ flows through the final element. Then what is the potential difference $V$ across input terminals of the chain ............... $\mathrm{volt}$View Solution
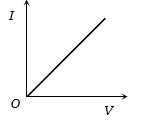
- 10$I-V$ characteristic of a copper wire of length $L$ and area of cross-section $A$ is shown in figure. The slope of the curve becomesView Solution