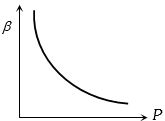
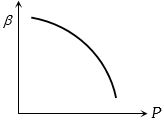
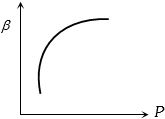
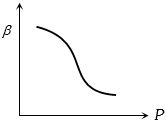
Which of the following graphs correctly represents the variation of $\beta = - (dV/dP)/V$ with $P$ for an ideal gas at constant temperature
- A
- B
- C
- D
Medium


Download our appand get started for free
Experience the future of education. Simply download our apps or reach out to us for more information. Let's shape the future of learning together!No signup needed.*
Similar Questions
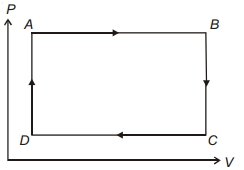
- 1The pressure and volume of a gas are changed as shown in the $P-V$ diagram in this figure. The temperature of the gas will ........View Solution
- 2View SolutionWhich of the following is incorrect regarding the first law of thermodynamics
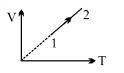
- 3An ideal gas undergoes the process $1 \rightarrow 2$ as shown in the figure, the heat supplied and work done in the process is $\Delta \,\,Q$ and $\Delta \,\,W$ respectively. The ratio $\Delta \,\,Q :$ $\Delta \,\,W$ isView Solution
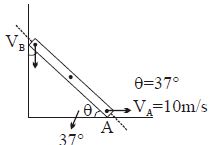
- 4Find $V_B = ?$View Solution
- 5$0.02\, moles$ of an ideal diatomic gas with initial temperature $20^{\circ} C$ is compressed from $1500 \,cm ^{3}$ to $500 \,cm ^{3}$. The thermodynamic process is such that $p V^{2}=\beta$, where $\beta$ is a constant. Then, the value of $\beta$ is close to (the gas constant, $R=8.31 \,J / K / mol$ ).View Solution
- 6One mole of an ideal monoatomic gas is heated at a constant pressure of one atmosphere from ${0^o}C$ to ${100^o}C$. Then the change in the internal energy isView Solution
- 7If $\Delta U$ and $\Delta W$ represent the increase in internal energy and work done by the system respectively in a thermodynamical process, which of the following is true?View Solution
- 8One mole of an ideal monoatomic gas is compressed isothermally in a rigid vessel to double its pressure at room temperature, $27\,^oC$.The work done on the gas will beView Solution
- 9In an Isobaric process, the work done by a di$-$atomic gas is $10\, J ,$ the heat given to the gas will be (in $J$)View Solution
- 10View SolutionIn a thermodynamic system working substance is ideal gas, its internal energy is in the form of