Coliform bacteria are mainly present in human faeces.
Drinking water should not contain more than 1 coliform per 100 mL.
The graph shows the amount of coliforms found in four water samples collected for a study.
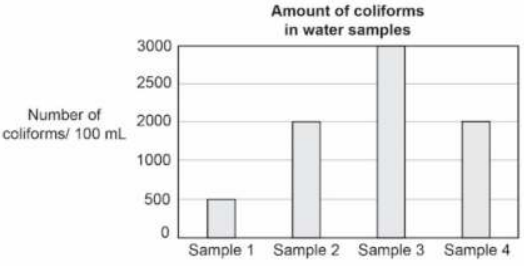
1. What can be concluded from the graph?
A. Sample 1 is safe for drinking.
B. Sample 3 is least contaminated with human faeces.
C. Sample 2 and sample 4 are collected from the same water source.
D. Sample 1 and sample 2 contain the same concentration of coliforms.
2. Bathing water should not contain more than 1000 coliforms per 100 mL.
Which water sample is safe for bathing?
A. Sample 1
B. Sample 2
C. Sample 3
D. Sample 4
3. The same study was repeated over a period of ive years.
Which questions can be answered by comparing the results of the study?
Circle ‘Yes’ or ‘No’ for the correct response.
Can this question be answered by the study? | Yes or No |
Is the pollution in the water sources increasing over time? | Yes/No |
Which water source is the most polluted? | Yes/No |
What are the chemical wastes present in the water sources? | Yes/No |
4. Industrial wastes entering rivers often make the river water acidic.
How can this lead to a decrease in the population of many aquatic organisms?
5. Which of these activities should be prohibited in water bodies to control water pollution?
A. Fishing
B. Swimming
C. Rowing boats
D. Washing Clothes
The table lists the number of species of plants and animals in four forests over a time period
| Year - 1980 | Year - 2000 |
Plants | Animals | Plants | Animals |
Forest 1 | 780 | 205 | 705 | 180 |
Forest 2 | 1255 | 410 | 1240 | 400 |
Forest 3 | 1740 | 685 | 1080 | 395 |
Forest 4 | 685 | 210 | 650 | 205 |
6. Which forest was the most biodiverse in the year 2000?
A. Forest 1
B. Forest 2
C. Forest 3
D. Forest 4
7. Which forest had the greatest loss of biodiversity between 1980 and 2000?
A. Forest 1
B. Forest 2
C. Forest 3
D. Forest 4
8. Which of these areas has the greatest biodiversity?
A. Desert
B. Rainforest
C. Grassland
D. Mountain
9. Which of these is a bad effect of burning fossil fuels?
A. Depletion of ozone layer
B. Increase in global warming
C. Increase in atmospheric nitrogen
D. Decrease in atmospheric oxygen
10. Which of these is an effect of construction of dams?
Circle ‘Yes’ or ‘No’ for the correct response.
Is this an effect of construction of dams? | Yes or No |
Loss of biodiversity | Yes/No |
Displacement of people | Yes/No |
Increase in the frequency of floods | Yes/No |