Questions

6 Marks Question

🎯

Test yourself on this topic

19 questions · timed · auto-graded

Question 16 Marks
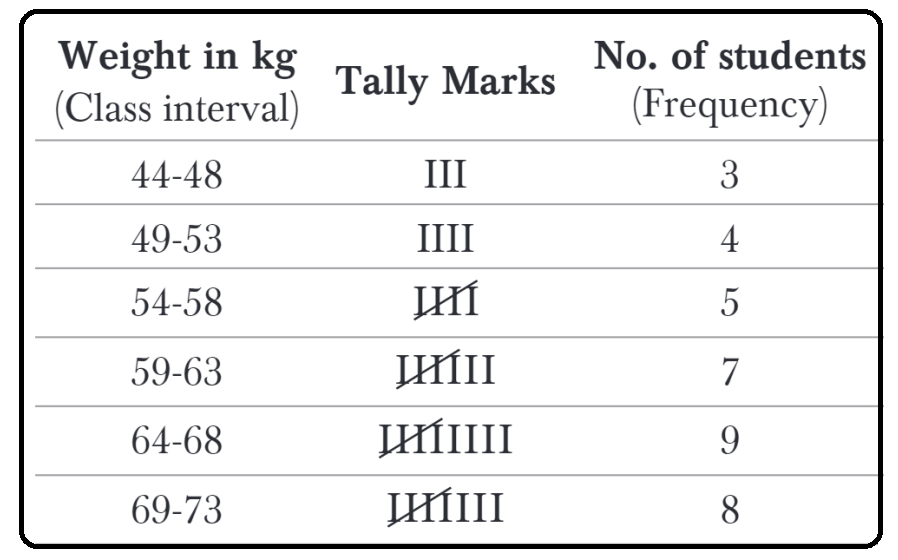
Direction Read the following case study table carefully and answer questions 1 to 5 on the basis of the same.
  1. The above series is an example of ..... series.
  1. Inclusive
  2. Exclusive
  3. Both (a) and (b)
  4. Neither (a) nor (b)
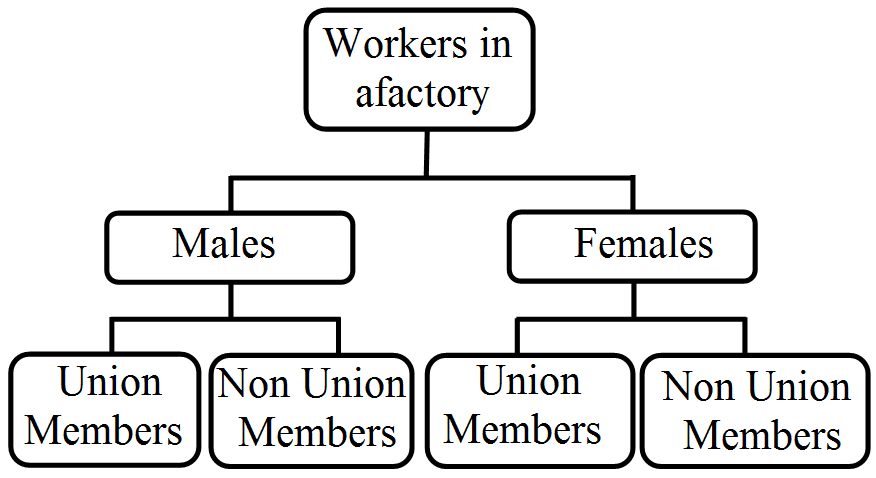
  1. The above situation shows which of the following types of presentation of data?
  1. Chronological classification
  2. Spatial classification
  3. Qualitative classification
  4. Quantitative classification
  1. What is the percentage of students having weight more than 63 kgs?
  1. 43.25%
  2. 47.22%
  3. 51.63%
  4. 62.32%
  1. How many students have weight less then 58 kgs?
  1. 12
  2. 15
  3. 7
  4. 10
  1. Variable which doesn't take integral values is known as .....
  1. Individual series
  2. Discrete series
  3. Continuous series
  4. None of the above
Answer
  1. (c) Qualitative classification
Explanation:

The given example is an example of qualitative classification as it is based upon the attribute of students i.e., weight.
  1. (b) 47.22%
Explanation:

Students having weight more than 63 kg are (9 + 8) = 17 So, the percentage will be $\Big(\frac{17}{36}\Big)\times100 = 47.22%$
  1. (a) 12
Explanation:

Students having weight less than 58 kgs are 12 ie, (84 + 4 + 5).
  1. (c) Continuous series
View full question & answer
Question 26 Marks
From the following frequency distribution, prepare 'less than' and 'more than' cumulative frequency distribution.
Weges (In ₹)
100-110
100-120
120-130
130-140
140-150
Number of Workers
4
12
20
7
5
Answer
Less Than' Cumulative Frequency Distribution.
Wages (In ₹)
Cumulative Frequency(cf)
Less than 110
4
Less than 120
16
Less than 130
36
Less than 140
43
Less than 150
48
‘More Than' Cumulative Frequency Distribution.
Wages (In ₹)
Cumulative Frequency (cf)
More than 100
48
More than 110
44
More than 120
32
Morte han 130
12
More than 140
5
View full question & answer
Question 36 Marks
Direction Read the following case study and answer questions 1 to 5 on the basis of the same.
Collection of data is the first step in a statistical analysis. Data can be collected either from primary source or secondary source. Primary data is original as it is being collected for the first time. After collecting the data, next step is to organise the data as raw data cannot be used for further statistical analysis. There are various methods of classification of data based upon the nature of quantitative data.
  1. Time series graphs are presented on the basis of general characteristics of a data. Choose from the options below.
  1. True
  2. False
  3. Partially true
  4. Incomplete statement
  1. Classification of data based on time period is known as ......... classification.
  1. Chronological
  2. Temporal
  3. Spatial
  4. Both (a) and (b)
  1. Data are grouped with reference to the attributes is referred to as ... classification.
  1. Qualitative
  2. Quantitative
  3. Both (a) and (b)
  4. Neither (a) nor (b)
  1. In which of the following method of frequency distribution, the upper limit of each class is excluded from the series but equal to the lower limit of the succeeding series?
  1. Continuous exclusive frequency distribution.
  2. Continuous inclusive frequency distribution.
  3. Continuous cumulative frequency distribution.
  4. None of the above.
Answer
  1. (b) False
Explanation:

Times series graphs are based upon the data given over different time period and not on the basis of general characteristics.
  1. (d) Both (a) and (b)
  1. (a) Qualitative
  1. (a) Continuous exclusive frequency distribution.
View full question & answer
Question 46 Marks
In a city 45 families were surveyed for the number of Cell phones they used. Prepare a frequency array based on their replies as recorded below.
1
3
2
2
2
2
1
2
1
2
2
3
3
3
3
3
3
2
3
2
2
6
1
6
2
1
5
1
5
3
2
4
2
7
4
2
4
3
4
2
0
3
1
4
3
Answer
The frequency array of cell phones used by 45 families is as follows:

Thus from the above frequency array we can conclude that, out of 45 families, one family is not using any cell phone, 7 families are using 1 cell phone, 15 families are using 2 cell phones, 12 families are using 3 cell phones, 5 families are using 4 cell phones, 2 families are using 5 cell phones, 2 are using 6 cell phones and only 1 family is using 7 cell phones.
View full question & answer
Question 56 Marks
Explain the ‘exclusive’ and ‘inclusive’ methods used in classification of data.
Answer
There are two methods of classifying data into class intervals.
  1. Exclusive method: Under this method the upper limits of one class is the lower limits of the next class. In this way continuity of the data is maintained. E.g. class intervals are 0-5, 5-10, 10-15 and so Now 5 is coming twice so is 10 and 15. So the upper limit of the class is excluded, means if a student has obtained 5 marks he is not included in the first group i.e. 0-5, but in the second i.e. 5-10.
  2. Inclusive method: Under this method upper limits of the class interval are also included in that class. The class interval will be made like 0-4, 5-9, 10-14 and so 0 This does not exclude the upper class limit in a class interval. Both class limits upper and lower limits are parts of the class interval.
View full question & answer
Question 66 Marks
Direction Read the following case study and answer questions 1 to 5 on the basis of the same.
Collection of data is an important step in statistics. However, raw data cannot be used unless organised in a meaningful way. Few examples of organisation are given below, observe these carefully and answer the questions.
  1. Production of wheat in India in 2001
Region
Production
(in million tonnes)
Rajasthan
5,000
UP
6,550
punjab
4,800
Haryana
4,200
  1. Marks of students in Statistics
Marks No. of students
01-09 05
10-19 08
20-39 02
40-69 06
70-79 05
  1. Table (a) shows which of the following methods of classification?
  1. Spatial classification
  2. Time series
  3. Quantitative classification
  4. None of the above
  1. In table (b), ......... series is used to arrange the data.
  1. Inclusive
  2. Exclusive
  3. Both(a) and (b)
  4. Neither (a) nor(b)
  1. Which of the following best describes the classification in table (b)?
  1. Unequal and exclusive
  2. Open - ended and exclusive
  3. Unequal and inclusive
  4. Open - ended and inclusive
  1. Which of the following is/are objective(s) of classification?
  1. It helps in summarising the data
  2. It enables further mathematical treatment
  3. It enhances human knowledge
  4. All of the above
  1. As per table (b), if a student has scored 19.5, it will be recorded in which class interval?
  1. 10 - 19
  2. 20 - 29
  3. Either (a) or (b)
  4. (d) None of these
Answer
  1. (a) Spatial classification
Explanation:
As the data is classified based upon the geographical area, it is known as geographical classification or spatial classification.
  1. (a) Inclusive
Explanation:
In an inclusive series, the upper limit of the first class is not equal to the lower limit of the succeeding class.
  1. (c) Unequal and inclusive
Explanation:
The given series is inclusive as well as unequal as the class interval/width are not same for all classes.
  1. (d) All of the above
  1. (d) None of these
Explanation:
In the given case, 19.5 can only be recorded once the series is converted into an exclusive series.
View full question & answer
Question 76 Marks
Explain different ways of classifying data.
Answer
Generally, data are classified on the basis of the following four bases: Geographical Classification: In geographical classification, data are classified on the basis of geographical or locational differences – such as cities, districts, or villages – between various elements of the data set. The following is an example of a geographical distribution. (Figures are hypothetical)
States of India
Punjab
Haryana
J & k
Bihar
Orissa
M.P.
Poverty (%)
12
10
3.5
39
38
34
Chronological Classification: When data are classified on the basis of time, the classification is known as chronological classification. Such classifications are also called time series because data are usually listed in chronological order starting with the earliest period. The following is an example of a Chronological distribution. (Figures are hypothetical)
Year
1951
1961
1971
1981
1991
2001
Poverty (%)
52
50
47
38
36
26
Another example can be:
Month
Family expenditure per member
January
2000
February
3000
March
1000
April
1200
May
2300
June
1400
July
1100
August
4300
September
900
October
1900
November
2100
December
3100
Qualitative Classification: In qualitative classification, data are classified on the basis of descriptive characteristics or on the basis of attributes like sex, literacy, region, caste, or education, which cannot be quantified. This is done in two ways: Simple classification: In this type of classification, each class is subdivided into two sub-classes and only one attribute is studied, for example male and female; blind and not blind, educated and uneducated; and so on. Manifold classification: In this type of classification, a class is subdivided into more than two subclasses which may be sub-divided further. An example is given below:
Quantitative Classification: In this classification, data are classified on the basis of characteristics which can be measured such as height, weight, income, expenditure, production, or sales. An example is given below:
Salary Per Month
No. of workers
0-10000
40
10,000-20,000
10
20000-30000
13
30000-40000
8
40,000-50,000
12
50,000 and above
7
View full question & answer
Question 86 Marks
The two important functions of classification are:
  1. Scrutiny and editing of data.
  2. Presentation and interpretation of data.
  3. Reducing bulk data and facilitating comparison.
  4. forming trend and tendencies.
Answer
  1. Reducing bulk data and facilitating comparison.
View full question & answer
Question 96 Marks
With the help of suitable example, explain conversion of an Inclusive Distribution into Exclusive Distribution.
Answer
In inclusive distribution, there is a gap or discontinuity between the upper class limit and lower class limit of the next class. To maintain the continuity, the class intervals are adjusted and an exclusive distribution is obtained. The adjustment is done with the help of following steps.
Step 1: The difference between the lower limit of second class and upper class limit of first class is obtained.
Step 2: The difference obtained is divided by 2.
Step 3: Value obtained in Step 2, is subtracted from lower limit of all the classes and added to the upper limit of all the classes.
Consider the given distribution.
Income of 350 Employees of a Company
Income (₹) Number of Employees
800-899 50
900-999 100
1000-1099 200
Total 350
Step 1: Difference between lower class limit of lind group and upper class limit of Ist group is computed which is 1 (900-899).
Step 2: This difference is divided by 2 and we get 0.5 $(\frac{1}{2}=0.5)$
Step 3: 0.5 will be subtracted from the lower class limit of each group and added to the upper class limit of each group.
View full question & answer
Question 106 Marks
What is a statistical series? Explain different types of statistical series on the basis of character.
Answer
According to Horace Secrist, "A series as used statistically may be defined as things or attributes of things arranged according to some logical order." According to Prof. Connor, "If two variable quantities can be arranged side by side so that measurable difference in the one corresponds with measurable difference in the other, the result is said to form a statistical series." On the Basis of Characteristics:
  1. Time Series: When series of values of some variable which is represented according to successive points in time is called time series. In such a series, data are represented with reference to a time period which can be a year, week, month or day. An example is given below:
Production in a cloth mill:
Year
2005
2006
2007
2008
2009
2010
Production (in 000 meters)
15
27
58
72
134
140
OR
Rainfall in a week
DAY
Mon
Tue
Wed
Thu
Fri
Sat
Sun
Rainfall in cm
15
27
17
14
54
64
10
  1. Spatial Series: A series of values of some variable which is represented according to area under investigation i.e. geographical division of the universe is called spatial series. An example is given below:
Production of wheat in different states of India in 2010
States
Punjab
Haryana
Maharashtra
U.P.
Bihar
Orissa
Production (in 000 tonnes)
1500
2700
580
720
134
140
  1. Condition Series: A series of values of some variables which is represented according to condition which may be expressed in quantitative terms is called condition series. An example is given below:
 
Grade
A
B
C
Total
Boys
13
25
11
49
Girls
7
20
6
33
Total
20
45
17
82
View full question & answer
Question 116 Marks
From the following frequency distribution, prepare 'less than' and 'more than’cumulative frequency distribution:
Wages (₹)
100-110
110-120
120-130
130-140
140-150
No of Workers
4
12
20
7
5
Answer
Wages(₹)
No. of Workers (f)
c.f.
(less than)
c.f.
(More than)
100-110
4
4
48
110-120
12
16
44
120-130
20
36
32
130-140
7
43
12
140-150
5
48
5
 
$\Sigma\text{f}=48$
 
 
View full question & answer
Question 126 Marks
Convert the following 'less than' cumulative frequency series into ‘more than' cumulative frequency series:
Marks (less than)
5
10
15
20
Cumulative Frequency
12
25
35
55
Answer
  1. .Step 1-Simple frequency series
Marks
f
0-5
12
5-10
13
10-15
10
15-20
20
 
$\Sigma\text{f}=55$
  1. Step II - 'More than ' cumulative series
Marks
c.f.
More than 0
55
More than 5
43
More than 10
30
More than 15
20
View full question & answer
Question 136 Marks
What is a variable? Differentiate between discrete and continuous variable.
Answer
A characteristic or phenomenon which,is capable of being measured and changes its value from time to time, place to place or situation to situation is called a variable. In other words, anything which is subject to change in value and can be measured is called a variable. Variable means "which varies". It may vary over time, person to person, place to place etc. for example, Income is a variable as it varies person to person (different people earn different incomes), place to place (salaries vary in India and America) and over time (salaries in 1951 were different from salaries in 2001). Temperature is a variable. It changes over time and also place to place. Height is a variable as it varies person to person and over time.
There are two types of Variable:
Discrete and Continuous
Discrete Variable: A discrete variable is one which increases in jumps or in complete numbers. For example, there can't be 2.4 workers in a factory. They can be 1, 2, 3, 4 and so on. Similarly, a factory can't have 4.8 or 2/7 machines. It will be in complete numbers like 1,2,3,4, and soon. Such variable are called discrete variable. Some other examples of discrete variable are number of workers in a factory, number of machines purchased, number of children etc.
Continuous Variable: Those variables which can assume any value in a given range and which increase continuously and not in jumps are called continuous variable. For example, weight of a person can be 45.234 kg, it can take any value within a range. No one gains weight in jumps. It increases in continuity. Other examples are height, income etc.
View full question & answer
Question 146 Marks
From the following data, relating to weights of 40 students in kg138, 164, 150, 131, 144, 125, 149, 157, 146, 148, 140, 147, 136, 148, 152, 144, 168, 126, 138, 176, 163, 119, 150, 165, 146, 173, 142, 147, 135, 153, 142, 135, 140, 135, 161, 145, 150, 156, 145, 128
  1. Obtain the range of weights of the students.
  2. Divide the range into appropriate number of class interval and obtain the frequency distribution.
  3. Find the number of students whose weight is.
  1. less than 145 kg.
  2. more than 155 kg.
  3. between 135 and 155 kg.
Answer
  1. Range =176 – 119 = 57
  1. The frequency distribution by dividing into appropriate classes is shown below.
  1. Number of students whose weight is weight is.
  1. less than 145 kg = 17 (12 + 4 +1)
  2. more than 155 kg = 9 (5 + 3 + 1)
  3. between 135 and 155 kg = 26 (12 + 14)
View full question & answer
Question 156 Marks
Explain important terms related to a frequency distribution.
Answer
To understand these terms we are taking two series for reference one is discrete frequency distribution and second is continuous frequency distribution. Series-1 Discrete Frequency Distribution
Shoe Size
7
8
9
10
11
12
No of students
8
12
20
10
6
4
Series 2 Continuous Frequency Distribution
Marks
0-10
10-20
20-30
30-40
40-50
50-60
No of students
8
12
20
10
6
4
  1. Frequency: Frequency is the number of times a value repeats itself in the observations. For example when we have written 8 before 7 in series 1, it means 8 students have a shoe size of 7 number in raw data. 12 students have got 8 size, 20 got 9 size and so on. It is applicable to discrete frequency distribution
  2. Class Frequency: Frequency of a class instead of specific observation is called class frequency. It shows how many items have a value in that class interval. For example, when we have written 10 in column of number of students in front of 30-40, it means 10 students have got marks equal to or more than 30 but less than 40.
  3. Class: It refers to decided group of magnitudes. For example, 0-10 in series 2. It may be 0-9, 10-19 or 4.5 – 8.5 and so on.
  4. Upper and Lower limits of the Class: Lower limit is the lower magnitude of the class and upper limit is the upper magnitude of class. For example in class 0-10, 10 is the lower limit and 10 is the upper limit.
  5. Total Frequency: It is the sum total of frequencies of all classes. It must be equal to total number of observations.
  6. Frequency Distribution: When observations are distributed over several values, it is termed as frequency distribution. For example, in above examples, I series is an example of discrete frequency distribution of shoe El size of students. Series 2 is a continuous 2 frequency distribution of marks obtained TREI by students.
  7. Class Interval: Class Interval refers to the magnitude spread between the lower and upper class limit. In other words, it is span or width of the class. It can be obtained by deducting lower limit from upper limit. It is applicable to continuous series only. In series two, class interval is 10 (10-0=10) for first class and for other classes as well. But it is not necessary that all classes should have same class interval. Depending on the purpose, unequal class intervals for different classes can also be used. For example:
Pocket Expenses Frequency
Frequency
0-10
2
10-30
9
30-100
3
100-500
5
500-1000
4
1000-2000
2
  1. Mid Value: It is the average of lower limit and upper limit. It can be obtained by dividing the sum of lower limit and upper limit by 2. For example, in series 2 given above, we can find mid values as follows:
Daily Income
No of families
Mid Value
0-100
5
50
100-200
9
150
200-300
12
250
300-400
2
350
500-600
2
450
  1. Discrete Series: A series which See represents a discrete variable is called discrete series. For example, series -1 of shoe size is a discrete series.
  2. Continuous Series: A series which represents continuous variable is called a continuous series. For example, in series 2, the distribution of marks amongst students is a continuous series.
View full question & answer
Question 166 Marks
Use the data in Table 3.2 that relate to monthly household expenditure (in ₹) on food of 50 households and:
  1. Obtain the range of monthly household expenditure on food.
  2. Divide the range into appropriate number of class intervals and obtain the frequency distribution of expenditure.
  3. Find the number of households whose monthly expenditure on food is:
  1. Less than ₹ 2000
  2. More than ₹ 3000
  3. Between ₹ 1500 and ₹ 2500
Answer
Table 3.2
Monthly Household Expenditure (in Rupees) on Food of 50 Households
1904
1559
3473
1735
2760
2041
1621
1753
1855
4439
5090
1085
1823
2346
1523
1211
1360
1110
2152
1183
1218
1315
1105
2628
2712
4248
1812
1264
1183
1171
1007
1180
1953
1137
2048
2025
1583
1324
2621
3676
1397
1832
1962
2177
2575
1293
1365
1146
3222
1396
  1. Calculation of Range:
Range = Highest Value - Lowest Value
Highest Value = 5090
Lowest Value = 1007
So, Range = 5090 - 1007 = 4083
  1. Frequency distribution of expenditure: Given that the lowest monthly household expenditure is 1007 and the highest monthly household expenditure is 5090. The distribution of frequencies will relate to values between 1000 and 5500. Thus, the class interval will be 500.
  1.  
  1. Number of households whose monthly expenditure on food is less than ₹ 2000
= 20 + 13 = 33
  1. Number of households whose monthly expenditure on food is more than ₹ 3000
= 2 + 1 + 2 + 0 + 1 = 6
  1. Number of households whose monthly expenditure on food is between ₹ 1500 and ₹ 2500
= 13 + 6 = 19
View full question & answer
Question 176 Marks
Convert the following inclusive series into exclusive series:
C.I.
1-5
6-10
11-15
16-20
21-25
No.of Workers
10
15
20
25
30
Answer
C.I.
f
0.5-5.5
10
5.5-10.5
15
10.515.5
20
15.5-20.5
25
20.5-25.5
30
 
$\Sigma\text{f}=100$
View full question & answer
Question 186 Marks
The following distribution shows the income of 50 households. Monthly Income (in)
Monthly Income (in ₹)
Number of Household
2000-4000
6
4000-6000
8
6000-8000
12
8000-10,000
14
10,000-12,000
10
Total
50
On the basis of the above distribution, answer the following questions:
  1. What will be the class frequency of the following groups?
  1. 4000-6000
  2. 8000-10,000
  1. What will be the upper and lower class limits of the following groups?
  1. 2000-4000
  2. 6000-8000
  1. What will be the class interval for the group 4000-6000?
  2. Find the class mid-point for the following groups:
  1. 8000-10,000
  2. 10,000-12,000
  1. Find the relative frequency of the following groups:
  1. 6000-8000
  2. 10,000-12,000
  1. Find the cumulative frequency of the following groups:
  1. 6000-8000
  2. 8000-10,000
  1. Which group has the highest concentration of data?
  2. Which group has the lowest concentration of data?
  3. What will be the frequency density of the group 80-90?
Answer
  1.  
  1. The class frequency of the group 4000-6000 is 8
  2. The class frequency of the group 8000-10,000 is 14
  1.  
  1. Upper class limit of the group 2000-4000 is 4000
Lower class limit of the group 2000-4000 is 2000
  1. Upper class limit of the group 6000-8000 is 8000
Lower class limit of the group 6000-8000 is 6000
  1. Class Interval
= Upper Class Limit - Lower Class Limit
= 6000 - 4000
= 2000
  1. Class mid-Point
$=\frac{\text{Upper Class Limit}+\text{Lower Class Limit}}{2}$
  1. Class Mid -Point (8,000 - 10,000)
$=\frac{10,000+10,000}{2}=11,000$
  1. Class mid-Point (10,000 - 12,000)
$=\frac{12,000+10,000}{2}=11,000 $
  1. ​​​$\text{Relative Frequency}=\frac{\text{Frequency of Class}}{\text{Total Frequancy}}\times100$
  1. Relative Frequaency (6000 - 8000)
$=\frac{12}{50}\times100=24\%$
  1. Relative Frequency (10,000 - 12,000)
$=\frac{10}{50}\times100=20\%$
  1.  
  1. Cumulative Frequency of Group 6000 - 8000 = 6 + 8 + 12 = 26
  2. Cumulative Frequency of Group 8000 - 10,000 = 6 + 8 + 12 + 14 = 40
  1. Group 8000-10,000 has the highest concentration of data.
  2. Group 2000-4000 has the lowest concentration of data.
  3. $\text{Frequency Density}=\frac{\text{Class Frequency}}{\text{Class Width}}$
$=\frac{5}{10}=0.5$
View full question & answer
Question 196 Marks
What do you mean by loss of information in organized data?
Answer
When we group data in a continuous series as shown below, we get to know
only the fact that 4 students have marks more than equal to or more than 0 and o less than 10 but we do not know the exact figures.
Marks
Frequency
0-10
4
10-20
7
20-30
4
30-40
3
40-50
2
Suppose all 4 had 1 mark, they will be in class 0-10 and even when all 4 have 9 marks, they will be in class0-10. It is called loss of information in organized data.
View full question & answer