Question types

Graphical Representation of Statistical Data question types

71 questions across 4 question groups — pick any mix to generate a Maths paper with step-by-step answer keys.

71
Questions
4
Question groups
5
Question types
Sample Questions

Graphical Representation of Statistical Data questions

One sample from each question group in this chapter. Select any group above to see the full set with answer keys.

Q 1M.C.Q1 Mark
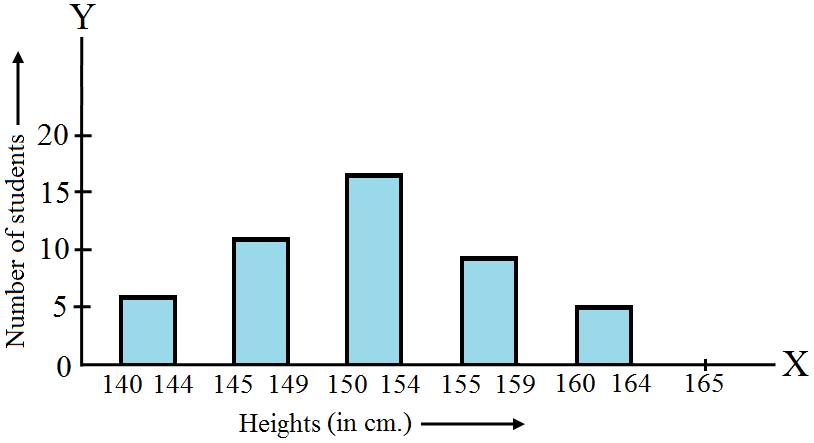
In a histogram the class intervals or the group are taken along:
  • A
    $Y$-axis.
  • $X$-axis.
  • C
    Both of $X$-axis and $Y$-axis.
  • D
    In between $X$ and $Y$ axis.

Answer: B.

View full solution
Q 2M.C.Q1 Mark
A frequency polygon is constructed by plotting frequency of the class interval and the:
  • A
    Upper limit of the class.
  • B
    Lower limit of the class.
  • Mid value of the class.
  • D
    Any values of the class.

Answer: C.

View full solution
Q 3M.C.Q1 Mark
In the 'less than' type of ogive the cumulative frequency is plotted against:
  • A
    The lower limit of the concerned class interval.
  • The upper limit of the concerned class interval.
  • C
    The mid-value of the concerned class interval.
  • D
    Any value of the concerned class interval.

Answer: B.

View full solution
Q 4M.C.Q1 Mark
In a histogram the area of each rectangle is proportional to:
  • A
    The class mark of the corresponding class interval.
  • B
    The class size of the corresponding class interval.
  • Frequency of the corresponding class interval.
  • D
    Cumulative frequency of the corresponding class interval.

Answer: C.

View full solution
Q 5M.C.Q1 Mark
In a histogram, each class rectangle is constructed with base as:
  • A
    Frequency.
  • Class-intervals.
  • C
    Range.
  • D
    Size of the class.

Answer: B.

View full solution
Draw a histogram for the daily earning of 30 drug stores in the following table:
Daily earning (in ₹): $450-500$ $500-550$ $550-600$ $600-650$ $650-700$
Number of stores: $16$ $10$ $7$ $3$ $1$
View full solution
Read the following bar graph and answer the following questions:
$i.$  What is the information given by the bar graph?
$ii.$ State each of the following whether true or false.
$a.$ The number of government companies in $1957$ is that of $1982$ is $1 : 9$.
$b.$ The number of government companies has decreased over the year $1957$ to $1983$.
View full solution
The following bar graph shows the results of an annual examination in a secondary school. Read the bar graph and choose the correct alternative in each of the following:

$i.$ The pair of classes in which the results of boys and girls are inversely proportional are:
$a. VI, VIII$
$b. VI, IX$
$c. VII, IX$
$d. VIII, X$
$ii.$ The class having the lowest failure rate of girls is:
$a. VI$
$b. X$
$c. IX$
$d. VIII$
$iii.$ The class having the lowest pass rate of students is:
$a. VI$
$b. VII$
$c. VIII$
$d. IX$
View full solution
Construct a histogram for the following data:
Monthly School fee (in ₹): $30-60$ $60-90$ $90-120$ $120-150$ $150-180$ $180-210$ $210-240$
No of schools $5$ $12$ $14$ $18$ $10$ $9$ $4$
View full solution
Q 103 Marks Question3 Marks
The following is the distribution of total household expenditure (in ₹) of manual worker in a city:
Expenditure (in ₹): $100-150$ $150-200$ $200-250$ $250-300$ $300-350$ $350-400$ $400-450$ $450-500$
No. of manual workers: $25$ $40$ $33$ $28$ $30$ $22$ $16$ $8$
Draw a histogram and a frequency polygon representing the above data.
View full solution
Read the following bar graph and answer the following questions:
$i.$ What information is given by the bar graph$?$
$ii.$ Which state is the largest producer of rice$?$
$iii.$ Which state is the largest producer of wheat$?$
$iv.$ Which state has total production of rice and wheat at its maximum$?$
$v.$ Which state has total production of wheat and rice at its minimum$?$
View full solution
The investments $($in ten crores of rupees$)$ of Life Insurance Corporation of India in different sectors is given below:
Sectors Investment $($in ten crores of rupess$)$
Central government securities $45$
State government securities $11$
Securities guaranteed by the government $23$
Private sectors $18$
Socially oriented sectors $($plan$)$ $46$
Socially oriented sectors $($Non$–$plan$)$ $11$
Represent the above data with the help of a bar graph.
View full solution
The population of Delhi State in different census years is as given below:
Census year
$1961$
$1971$
$1981$
$1991$
$2001$
Population in Lakhs
$30$
$55$
$70$
$110$
$150$
Represent the above information with the help of a bar graph.
View full solution
The following data gives the demand estimates of the Government of India, Department of Electronics for the personnel in the Computer sector during the Eighth Plan period $(1990–95):$
Qualifications
$MCA ($Masters in Computer Applications$)$
$DCA ($Diploma in Computer Applications$)$
$DCE ($Diploma in Computer Engineering$)$
$CL ($Certificate Level Course$)$
$ST ($Short Term Course$)$
Personnel required
$40600$
$181600$
$18600$
$670600$
$1802900$
Represent the data with the help of a bar graph. Indicate with the help of the bar graph the course where the estimated requirement is least.
View full solution
The following bar graph represents the heights $($in $cm)$ of $50$ students of Class $XI$ of a particular school. Study the graph and answer the following questions:

$i.$ What percentage of the total number of students have their heights more than $149\ cm?$
$ii.$ How many students in the class are in the range of maximum height of the class$?$
$iii.$The school wants to provide a particular type of tonic to each student below the height of $150\ cm$ to improve his height. If the cost of the tonic for each student comes out to be $Rs. 55,$ how much amount of money is required$?$
$iv.$ How many students are in the range of shortest height of the class$?$
$v.$ State whether true or false:
$a.$ There are $9$ students in the class whose heights are in the range of $155-159\ cm.$
$b.$ Maximum height $($in $cm)$ of a student in the class is $17.$
$c.$ There are $29$ students in the class whose heights are in the range of $145-154\ cm$
$d.$ Minimum height $($in $cm)$ of a student is the class is in the range of $140-144\ cms.$
$e.$ The number of students in the class having their heights less than $150\ cm$ is $12.$
$f.$ There are $14$ students each of whom has height more than $154\ cm$
View full solution
Read the following bar graph and answer the following questions:
$i.$ What information is given by the bar graph?
$ii.$ In which year the export is minimum?
$iii.$ In which year the import is maximum?
$iv.$ In which year the difference of the values of export and import is maximum?
View full solution
The production of oil (in lakh tonnes) in some of the refineries in India during $1982$ was given below:
Refinery
Barauni
Koyali
Mathura
Mumbai
Florida
Production of oil (in lakh tonnes)
$30$
$70$
$40$
$45$
$25$
Construct a bar graph to represent the above data so that the bars are drawn horizontally.
View full solution
The income and expenditure for $5$ years of a family is given in the following data:
Years
$1995–96$
$1996–97$
$1997–98$
$1998–99$
$1999–2000$
Income (Rs. In thousands)
$100$
$140$
$150$
$170$
$210$
Expenditure (Rs. in thousands)
$80$
$130$
$145$
$160$
$190$
Represent the above data by a bar graph.
View full solution
The following table shows the interest paid by a company (in lakhs):
Year
$1995–96$
$1996–97$
$1997–98$
$1998–99$
$1999–2000$
Interest (in lakhs of rupees)
$20$
$25$
$15$
$18$
$30$
Draw the bar graph to represent the above information.
View full solution
Study the bar graph representing the number of persons in various age groups in a town shown in figure Observe the bar graph and answer the following questions:
$i.$ What is the percentage of the youngest age$-$group persons over those in the oldest age group $?$
$ii.$ What is the total population of the town $?$
$iii.$ What is the number of persons in the age-group $60–65?$
$iv.$ How many persons are more in the age-group $10–15$ than in the age group $30–35?$
$v.$ What is the age$-$group of exactly $1200$ persons living in the town $?$
$vi.$ What is the total number of persons living in the town in the age$-$group $50–55?$
$vii.$ What is the total number of persons living in the town in the age$-$groups $10 – 15$ and $60 – 65?$

$viii.$ Whether the population in general increases, decreases or remains constant with the increase in the age$-$group.
View full solution

Generate a Graphical Representation of Statistical Data paper free

Pick question groups from the list above, set marks and difficulty, and export a branded PDF with step-by-step answer keys. First 3 chapters free — no signup.

Download App