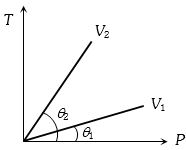
From the following $P-T$ graph what interference can be drawn
Medium


Download our appand get started for free
Experience the future of education. Simply download our apps or reach out to us for more information. Let's shape the future of learning together!No signup needed.*
Similar Questions
- 1View SolutionKinetic theory of gases provide a base for
- 2The kinetic energy of one gram molecule of a gas at normal temperature and pressure is $(R = 8.31\,J/mole - K)$View Solution
- 3A gaseous mixture contains equal number of hydrogen and nitrogen molecules. Specific heat measurements on this mixture at temperatures below $100\, K$ would indicate that the value of $\gamma $ (ratio of specific heats) for this mixture isView Solution
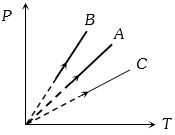
- 4Pressure versus temperature graph of an ideal gas at constant volume $V$ of an ideal gas is shown by the straight line $A$. Now mass of the gas is doubled and the volume is halved, then the corresponding pressure versus temperature graph will be shown by the lineView Solution
- 5The value of densities of two diatomic gases at constant temperature and pressure are ${d_1}$ and ${d_2}$, then the ratio of speed of sound in these gases will beView Solution
- 6$N( < 100)$ molecules of a gas have velocities $1, 2, 3\,.\,.\,.\,.\,.N/km/s$ respectively. ThenView Solution
- 7If one mole of the polyatomic gas is having two vibrational modes and $\beta$ is the ratio of molar specific heats for polyatomic gas $\left(\beta=\frac{ C _{ P }}{ C _{ v }}\right)$ then the value of $\beta$ is:View Solution
- 8To what temperature should the hydrogen at room temperature $(27°C)$ be heated at constant pressure so that the $R.M.S.$ velocity of its molecules becomes double of its previous value ....... $^oC$View Solution
- 9View SolutionWhich of the following plots represents schematically the dependence of the time period of a pendulum, if measured and plotted as a function of the amplitude of its oscillations? (Note amplitude need not be small)
- 10View SolutionThe degrees of freedom of a triatomic gas is