MCQ
The voltage $V$ and current $I$ graph for a conductor at two different temperatures ${T_1}$ and ${T_2}$ are shown in the figure. The relation between ${T_1}$ and ${T_2}$ is
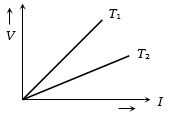
- ✓${T_1} > {T_2}$
- B${T_1} \approx {T_2}$
- C${T_1} = {T_2}$
- D${T_1} < {T_2}$