Two pendulums have time periods $T$ and $5T/4.$ They start $SHM$ at the same time from the mean position. After how many oscillations of the smaller pendulum they will be again in the same phase :
Advanced
Download our app for free and get started
When the pendulum $A$ with time period $\frac{5 T}{4}$ completes phase of $2 \pi$ in $\frac{5 T}{4},$ the other pendulum $B$ leads by phase $\frac{\pi}{2}$.
So after $4$ oscillations of pendulum $A$ i.e. after $5 T$, pendulum $B$ leads by $2 \pi$ i.e they come in phase.
i.e. after $5$ oscillations of small pendulum (Time taken $=5 T$ ), they will again come in the same phase.

Download our appand get started for free
Experience the future of education. Simply download our apps or reach out to us for more information. Let's shape the future of learning together!No signup needed.*
Similar Questions
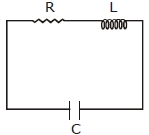
- 1An $LCR$ circuit is equivalent to a damped pendulum. In an $LCR$ circuit the capacitor is charged to $Q_0$ and then connected to the $L$ and $R$ as shown below.View Solution
If a student plots graphs of the square of maximum charge $( Q_{Max} ^2 )$ on the capacitor with time$(t)$ for two different values $L_1$ and $L_2 (L_1 > L_2)$ of $L$ then which of the following represents this graph correctly? (plots are schematic and not drawn to scale)
- 2For a periodic motion represented by the equation $Y=\sin \omega t+\cos \omega t$ The amplitude of the motion isView Solution
- 3Column $I$ gives a list of possible set of parameters measured in some experiments. The variations of the parameters in the form of graphs are shown in Column $II$. Match the set of parameters given in Column $I$ with the graph given in Column $II$. Indicate your answer by darkening the appropriate bubbles of the $4 \times 4$ matrix given in the $ORS$.View Solution
Column $I$ Column $II$ $(A)$ Potential energy of a simple pendulum (y axis) as a function of displacement ( $\mathrm{x}$ axis) $Image$ $(B)$ Displacement (y axis) as a function of time (x axis) for a one dimensional motion at zero or constant acceleration when the body is moving along the positive $\mathrm{x}$-direction $Image$ $(C)$ Range of a projectile (y axis) as a function of its velocity ( $\mathrm{x}$ axis) when projected at a fixed angle $Image$ $(D)$ The square of the time period (y axis) of a simple pendulum as a function of its length ( $\mathrm{x}$ axis) $Image$ 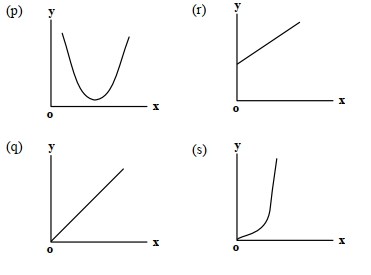
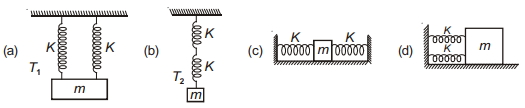
- 4A mass $m$ is attached to two springs of same force constant $K$, as shown in following four arrangements. If $T_1, T_2, T_3$ and $T_4$ respectively be the time periods of oscillation in the following arrangements, in which case time period is maximum?View Solution
- 5A simple pendulum is set up in a trolley which moves to the right with an acceleration a on a horizontal plane. Then the thread of the pendulum in the mean position makes an angle $\theta $ with the verticalView Solution
- 6A particle of mass $m$ undergoes oscillations about $x=0$ in a potential given by $V(x)-\frac{1}{2} k x^2-V_0 \cos \left(\frac{x}{a}\right)$, where $V_0, k, a$ are constants. If the amplitude of oscillation is much smaller than $a$, the time period is given byView Solution
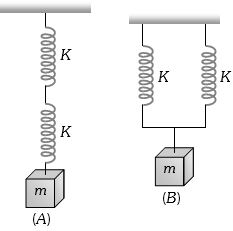
- 7Two identical spring of constant $K$ are connected in series and parallel as shown in figure. A mass $m$ is suspended from them. The ratio of their frequencies of vertical oscillations will beView Solution
- 8A light balloon filled with helium of density $\rho_{ He }$ is tied to a long light string of length $l$ and the string is attached to the ground. If the balloon is displaced slightly in the horizontal direction from the equilibrium and released. Then,View Solution
- 9View SolutionThe effective spring constant of two spring system as shown in figure will be
- 10A particle is executing $S.H.M.$ with time period $T^{\prime}$. If time period of its total mechanical energy is $T$ then $\frac{T^{\prime}}{T}$ is ........View Solution