MCQ
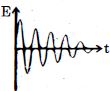
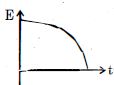
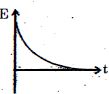
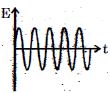
Which of the diagrams shown in figure represents variation of total mechanical energy of a pendulum oscillating in water as function of time?
- A
- B
- ✓
- D
Generate a complete, print-ready paper with questions like this in minutes — across 16+ boards, with answer keys.