MCQ 11 Mark
The mean of $100$ items was found to be $64$. Later on it was discovered that two items were misread as $26$ and $9$ instead of $36$ and $90$ respectively. The correct mean is:
- ✓
$64.91$
- B
$65.31$
- C
$64.61$
- D
$64.86$
AnswerCorrect option: A. $64.91$
Mean of $100$ items $= 64$
Sum of $100$ items $= 64 × 100 = 6400$
Correct sum $= (6400 + 36 + 90 - 26 - 9) = 6491$
Correct mean $=\frac{6491}{100}=64.91$
View full question & answer→MCQ 21 Mark
A grouped frequency distribution table with classes of equal sizes using $63-72 (72$ included$)$ as one of the class is constructed for the following data $30, 32, 45, 54, 74, 78, 108, 112, 66, 76, 88, 40, 14, 20, 15, 35, 44, 66, 75, 84, 95, 96, 102, 110, 88, 74, 112, 14, 34, 44.$ How many classes can we have$?$
AnswerThe given frequency varies from $14$ to $112.$
So the class intervals are:
$13-22, 23-32, 33-42, 43-52, 53-62, 63-72, 73-82, 83-92, 93-102, 103-112.$
Number of class interval $= 10.$
View full question & answer→MCQ 31 Mark
The class mark of the class $90-120$ is:
AnswerClass mark $=\frac{190+120}{2}=\frac{210}{2}=105$
View full question & answer→MCQ 41 Mark
The mean of $100$ items was found to be $64.$ Later on it was discovered that two items were misread as $26$ and $9$ instead of $36$ and $90$ respectively. The correct mean is:
- A
$64.86$
- B
$65.31$
- ✓
$64.91$
- D
$64.61$
AnswerCorrect option: C. $64.91$
Calculated sum $= 64 × 100 = 6400$
Correct sum of these numbers
$= 6400 + ($sum of correct term$) - ($sum of incorrect term$)$
$= 6400 + (36 + 90) - (26 + 9)$
$= 6400 + 36 + 90 - 26 - 9$
$= 6491$
Correct mean $=\frac{6491}{100}$
$=64.91$
View full question & answer→MCQ 51 Mark
For which set of data does the median equal the mode$?$
- ✓
$3, 3, 4$
- B
$3, 3, 4, 5$
- C
$3, 4, 5, 6, 6$
- D
$3, 3, 4, 5, 6$
AnswerCorrect option: A. $3, 3, 4$
The median is the middle score for a set of data that has been arranged in ascending or descending order of magnitude.
Mode in a list of numbers refers to the integers that occur most number of times.
For list $3, 3, 4$
Both median and mode are $3.$
View full question & answer→MCQ 61 Mark
In a grouped frequency distribution, the class intervals are $1-20, 21-40, 41-60,....$ then the class width is:
AnswerThe class width is the difference between the upper- or lower-class limits of consecutive classes.
In this case, class width equals to the difference between the lower limits of the first two classes.
Let, W be the class width
$W = 21 - 1 = 20$
So class width is $20$
View full question & answer→MCQ 71 Mark
In a frequency distribution, ogives are graphical representation of:
AnswerAn o$-$give $($oh$-$jive$),$ sometimes called a cumulative frequency polygon, is a type of frequency polygon that shows cumulative frequencies.
An o$-$give graph plots cumulative frequency on the $y-$axis and class boundaries along the $x-$axis.
View full question & answer→MCQ 81 Mark
For the frequency distribution given below, the adjusted frequency for the class $25-45$ is:
|
Class Interval
|
$5-10$
|
$10-15$
|
$15-25$
|
$25-45$
|
$45-75$
|
|
Frequency
|
$6$
|
$12$
|
$10$
|
$8$
|
$15$
|
AnswerAdjusted frequency for the class $25-45$ is
$10 - 8 = 2$
View full question & answer→MCQ 91 Mark
Median of the following observations, arranged in an ascending order is $22.$ If the numbers are $8, 11, 13, 15, x + 1, x + 3, 30, 35, 40, 43.$ Then, the value of $x$ is:
AnswerThe median is the middle score for a set of data that has been arranged in ascending or descending order of magnitude.
For even number of observations, median is calculated as average of two middle number
$22=\frac{(\text{x}+1)+(\text{x}+3)}{2}$
$44=2\text{x}+4$
$40=2\text{x}$
$\text{x}=20$
View full question & answer→MCQ 101 Mark
Let $L$ be the lower class boundry of a class in a frequency distribution and m be the midpoint of the class. Which one of the following is the upper class boundry of the class?
AnswerCorrect option: C. $2\text{m}-\text{L}$
Mid value $=\frac{\text{Lower}\ \text{limit}+\text{Upper}\ \text{limit}}{2}$
$\Rightarrow\text{m}=2\text{m}-\text{L}$
$\therefore$ Upper class boundry of the class $= 2m - L.$
View full question & answer→MCQ 111 Mark
Class size of a distribution having $28, 34, 40, 46$ and $52$ as its class marks is:
AnswerClass size is the difference between two consecutive values of the class mark.
Here, the difference between two consecutive class mark is $6.$
i.e., $34 - 28 = 6$
View full question & answer→MCQ 121 Mark
If the mode of the data is $45$ and the median is $33,$ then the mean is:
AnswerSince, $3$ Median $= 2$ Mean $+$ Mode
$\therefore 3 × 33 = 2$ Mean $+ 45$
$⇒ 2$ Mean $= 99 - 45$
$⇒ 2$ Mean $= 54$
$⇒$ Mean $= 27$
View full question & answer→MCQ 131 Mark
The mean of $30$ observations is $12.$ If $25$ is subtracted from the sum of observations, then remaining sum is:
AnswerLet sum of all the $30$ observations be $x.$
The mean is equal to the sum of all the values in the data set divided by the number of values in the data set.
$\frac{\text{x}}{30}=12$
$\text{x}=360$
$360-25=335$
View full question & answer→MCQ 141 Mark
In a histogram the class intervals or the group are taken along:
AnswerCorrect option: B. $X-$axis.
In a histogram the class intervals or the groups are taken along the horizontal axis or $X−$axis.
View full question & answer→MCQ 151 Mark
The given cumulative frequency distribution shows the class intervals and their corresponding cumulative frequencies. Then the frequency of class interval $20-30$ is:
|
Class
|
$10-20$
|
$20-30$
|
$30-40$
|
|
Cumulative frequency
|
$5$
|
$14$
|
$25$
|
AnswerA cumulative frequency distribution is the sum of the class and all classes below it in a frequency distribution.
Subtract the previous cumulative frequency (c.f.) from the cumulative frequency of the current class.
So frequency of the class interval $20 - 30$ is $14 - 5 = 9$
View full question & answer→MCQ 161 Mark
Let $l$ be the lower class limit of a class-interval in a frequency distribution and m be the mid point of the class. Then, the upper class limit of the class is:
AnswerCorrect option: C. $2\text{m}-1$
Given that, the lower class limit of a class-interval is l and the mid-point of the class is $m.$ Let $u$ be the upper class limit of the class-interval.
Therefore, we have
$\text{m}=\frac{\text{l+u}}{2}$
$⇒ l + u = 2m$
$⇒ u = 2m - l$
Thus the upper class limit of the class is $(2m - l).$
Hence, the correct choice is $(c).$
View full question & answer→MCQ 171 Mark
In a frequency distribution, the mid value of a class is $10$ and the width of the class is $6.$ The lower limit of the class is:
AnswerMid-value $= 10$
$\Rightarrow\frac{\text{Upper limit + Lower limit }}{2}=10$
$⇒$ Upper limit $+$ Lower limit $= 20 .....(i)$
Also, Class length $= 6$
$⇒$ Upper limit $-$ lower limit $= 6 .....(ii)$
Subtracting $(ii)$ from $(i),$ we get
$2 ×$ Lower limit $= 14$
$⇒$ Lower limit $= 7$
View full question & answer→MCQ 181 Mark
The class marks of a frequency distribution are $15, 20, 25, 30 ...., .$ The class corresponding to the class mark $20$ is:
- A
$12.5-17.5$
- ✓
$17.5-22.5$
- C
$18.5-21.5$
- D
$19.5-20.5$
AnswerCorrect option: B. $17.5-22.5$
We are given frequency distribution $15, 20, 25, 30 ....$
Class size $= 20 - 15 = 5$
Class marks $= 20$
Lower limit $=\Big(20-\frac{5}{2}\Big)$
$=\frac{35}{2}=17.5$
Upper limit $=\Big(20+\frac{5}{2}\Big)$
$=\frac{45}{2}=22.5$
Thus, the required class is $17.5-22.5.$
View full question & answer→MCQ 191 Mark
The class-mark of the class $130-150$ is:
AnswerClass mark $=\frac{130+150}{2}=\frac{280}{2}=140$
View full question & answer→MCQ 201 Mark
The traffic police recorded the speed $\big(\text{ in }\frac{\text{km}}{\text{h}}\big)$ of $10$ motorists as $48, 52, 57, 55, 42, 39, 60, 49, 53$ and $47.$ Later an error in recording instrument was found. If the instrument has recorded the speed $\frac{5\text{km}}{\text{h}}$ less in each case, then the correct average speed of the motorists is:
- A
$\frac{50.2\text{km}}{\text{h}}$
- B
$\frac{54.5\text{km}}{\text{h}}$
- ✓
$\frac{55.2\text{km}}{\text{h}}$
- D
$\frac{52.5\text{km}}{\text{h}}$
AnswerCorrect option: C. $\frac{55.2\text{km}}{\text{h}}$
Sum of all the recorded speeds is
$48 + 52 + 57 + 55 + 42 + 39 + 60 + 49 + 53 + 47 = 502$
Because of the error, $\frac{5\text{km}}{\text{h}}$ in each case
The sum increases by $50$ i.e., $552$
So the average speed of $10$ vehicle is $\frac{55.2\text{km}}{\text{h}}$
View full question & answer→MCQ 211 Mark
Mode of the data $15, 17, 15, 19, 14, 18, 15, 14, 16, 15, 14, 20, 19, 14, 15$ is:
AnswerArranging the marks in an ascending order,
We have:
$14, 14, 14, 14, 15, 15, 15, 15, 16, 17, 18, 19, 19, 20$
Clearly, $15$ occurs maximum number of times.
Hence, mode $= 15$
View full question & answer→MCQ 221 Mark
Given the class intervals $1-10, 11-20, 21-30, …,$ then $20$ is considered in class:
- A
$15-25$
- B
$21-30$
- ✓
$11-20$
- D
$11-30$
AnswerCorrect option: C. $11-20$
In a discontinuous class both lower and upper limits belong to that particular class.
View full question & answer→MCQ 231 Mark
A data is such that its maximum value is $75$ and range is $20,$ then the minimum value is:
AnswerDifference between the maximum & minimum value to the observations is called as range.
Let, minimum value be $'x'$
$75 - x = 20$
$So, x = 55$
View full question & answer→MCQ 241 Mark
Write the correct answer in the following: If $\bar{\text{x}}$ represents the mean of n observations $x_1, x_2, \ldots x_n$ then value of $\sum\limits_{\text{i}=1}^\text {b} \text{x}_\text{i}-\bar{\text{x}}$ is:
AnswerWe know that algebraic sun of deviations from mean is zero.
$\sum\limits_{\text{a}=1}^\text{b} (\text{x}_\text{t}-\bar{\text{x}})=(\text{x}_1-\bar{\text{x}})+(\text{x}_2-\bar{\text{x}})+(\text{x}_3-\bar{\text{x}})+\ ...\ +(\text{x}_\text{n}-\bar{\text{x}})$
$= (\text{x}_1+\text{x}_2+\text{x}_3+... +\text{x}_\text{n})- \text{n}\bar{\text{x}}$
$\Rightarrow\sum\limits_{\text{t}-1}^\text{b}\text{x}_\text{i}-\text{n}\bar{\text{x}}=\text{n}\bar{\text{x}}-\text{n}\bar{\text{x}}=0$ $\bigg[\because\sum\limits_{\text{i}=1}^\text{n} \text{x}_\text{i}=\text{n}\bar{\text{x}}\bigg]$
Hence, $(b)$ is correct answer.
View full question & answer→MCQ 251 Mark
A set of data consists of six numbers: $7, 8, 8, 9, 9,$ and $x.$ The difference between the modes when $x = 9$ and $x = 8$ is:
AnswerThe mode in a list of numbers refers to the integers that occur most number of times.
In the given list both $8$ and $9$ occur two times.
So the value of $x$ will decide the mode
If $x = 8,$ then the mode will be $8$
If $x = 9,$ then the mode will be $9$
Hence, the difference between the two modes is $1.$
View full question & answer→MCQ 261 Mark
Which of the following is not a measure of central tendency?
AnswerThe most common measures of central tendency are mean, median and mode.
Standard deviation is a measure of the dispersion of a set of data from its mean.
It is calculated as the square root of variance.
Hence standard deviation is not a measure of central tendency.
View full question & answer→MCQ 271 Mark
AnswerMost Frequent value is called mode.
View full question & answer→MCQ 281 Mark
If each observation of the data is decreased by $8$ then their mean:
AnswerCorrect option: B. is decreased by $8.$
If each observation of the data is decreased by $8$ then their mean is also decreased by $8.$
View full question & answer→MCQ 291 Mark
Less than’ cumulative frequency table for a given data is as follows. Then, the frequency of class interval $20-30$ is:
|
Marks
|
Less than $10$
|
Less than $20$
|
Less than $300$
|
Less than $40$
|
|
Cumulative frequency
|
$3$
|
$17$
|
$37$
|
$92$
|
AnswerA cumulative frequency distribution is the sum of the class and all classes below it in a frequency distribution.
Less than $30$ has the class interval $20-30.$ Frequency of this class interval will be corresponding to.
|
Marks
|
Cumulative frequency
|
Class
|
Frequency
|
|
Less than $10$
|
$3$
|
$1-10$
|
$3$
|
|
Less than $20$
|
$17$
|
$10-20$
|
$14$
|
|
Less than $30$
|
$37$
|
$20-30$
|
$20$
|
|
Less than $40$
|
$92$
|
$30-40$
|
$55$
|
View full question & answer→MCQ 301 Mark
If, for the set of observations $4, 7, x, 8, 9, 10$ the mean is $8,$ then $x$ is equal to:
AnswerThe mean is equal to the sum of all the values in the data set divided by the number of values in the data set.
$\frac{4+7+\text{x}+8+9+10}{5}=8$
$\frac{(38+\text{x})}{6}=8$
$\text{x}=48-38=10$
View full question & answer→MCQ 311 Mark
Find out the mode of the following: $5, 4, 3, 5, 6, 6, 6, 5, 4, 5, 5, 3, 2, 1.$
AnswerThe observation which occurs maximum number of times is called as mode of the given data.
View full question & answer→MCQ 321 Mark
If the mean of five observations $x, x + 4, x + 6$ and $x + 8$ is $11$ then the value of $x$ is:
AnswerMean of 5 observations $= 11$
$\text{Mean}=\frac{\text{Sum of all observations}}{\text{Total number of observation}}$
$\Rightarrow11=\frac{\text{x}+\text{x}+2+\text{x}+4+\text{x}+6+\text{x}+8}{5}$
$\Rightarrow11=\frac{5\text{x}+20}{5}$
$\Rightarrow55=5\text{x}+20$
$\Rightarrow5\text{x}=35$
$\Rightarrow\text{x}=7$
View full question & answer→MCQ 331 Mark
Which of the following is not a measure of central tendency?
AnswerA measure of central tendency is a single value that attempts to describe a set of data.
Mean, median and mode are the measures of central tendency.
Standard deviation is not the measure of central tendency.
View full question & answer→MCQ 341 Mark
If the mean of $x$ and $\frac{1}{\text{x}}$ is $M,$ then the mean of $x^3$ and $\frac{1}{\text{x}^3}$ is:
- A
$3M^3 + 4M$
- ✓
$4M^3 - 3M$
- C
$3M^3 - 4M$
- D
$4M^3 + 3M$
AnswerCorrect option: B. $4M^3 - 3M$
Given $\bigg(\frac{\text{x}+\frac{1}{\text{x}}}{2}\bigg)^2=(\text{M})^2$
Taking cube on both sides
$\bigg(\frac{\text{x}+\frac{1}{\text{x}}}{2}\bigg)^3=(\text{M})^3$
$\bigg(\text{x}+{\frac{1}{\text{x}}}\bigg)^3=(2\text{M})^3$
$\bigg(\text{x}^2+3\text{x}\times{\frac{1}{\text{x}}}\Big(\text{x}+\frac{1}{\text{x}}\Big)+\frac{1}{\text{x}^3}\bigg)=(2\text{M})^3$
$\bigg(\text{x}^3+{\frac{1}{\text{x}^3}}\bigg)={8\text{M}^3-3}\Big(\text{x}+\frac{1}{\text{x}}\Big)$
Divide by $2$ on both sides to get mean
$\frac{\bigg(\text{x}^3+{\frac{1}{\text{x}^3}}\bigg)}{2}={4\text{M}^3-\frac{3}{2}}\Big(\text{x}+\frac{1}{\text{x}}\Big)$
$\frac{\bigg(\text{x}^3+{\frac{1}{\text{x}^3}}\bigg)}{2}={4\text{M}^3}-{3\text{M}}$
View full question & answer→MCQ 351 Mark
A die is thrown $1000$ times and the outcomes were recorded as follows:
|
Outcome
|
$1$
|
$2$
|
$3$
|
$4$
|
$5$
|
$6$
|
|
Frequency
|
$180$
|
$150$
|
$160$
|
$170$
|
$150$
|
$190$
|
find probability of$?$ - A
$\frac{9}{50}$
- B
$\frac{4}{25}$
- C
$\frac{7}{25}$
- ✓
$\frac{3}{20}$
AnswerCorrect option: D. $\frac{3}{20}$
$\frac{150}{1000}=\frac{3}{20}$
View full question & answer→MCQ 361 Mark
The class mark of the class $100-200$ is:
AnswerClass mark $=\frac{\text{Upper}\ \text{limit}+\text{Lower}\ \text{limit}}{2}$
$=\frac{120+100}{2}$
$=110$
View full question & answer→MCQ 371 Mark
Write the correct answer in the following: A grouped frequency table with class intervals of equal sizes using $250-270 (270$ not included in this interval$)$ as one of the class interval is constructed for the following data: $268, 220, 368, 258, 242, 310, 272, 342, 310, 290, 300, 320, 319, 304, 402, 318, 406, 292, 354, 278, 210, 240, 330, 316, 406, 215, 258, 236.$ The frequency of the class $310-330$ is:
AnswerThe observation corresponding to class $310–330 (330$ not included in this interval$)$ are $310, 310, 320, 319, 318, 316,$ i.e., $6$ observations.
View full question & answer→MCQ 381 Mark
The number of times a particular item occurs in a given data is called its:
AnswerThe number of times a particular item occurs in a given data is called the frequency of the item. Hence, the correct choice is $(b).$
View full question & answer→MCQ 391 Mark
The smallest of three consecutive even integers is $32.$ Then, the mean of the three integers is:
Answer$32$ is the smallest even integer.
So three consecutive even integers are $32, 34$ and $36$
The mean is equal to the sum of all the values in the data set divided by the number of values in the data set.
$\frac{32+34+36}{3}=34$
View full question & answer→MCQ 401 Mark
The following marks were obtained by the students in a test: $81, 72, 90, 90, 86, 85, 92, 70, 71, 83, 89, 95, 85, 79, 62$ The range of the marks is:
AnswerThe marks obtained by the students are $81, 72, 90, 90, 86, 85, 92, 70, 71, 83, 89, 95, 85, 79$ and $62.$
The highest and lowest marks are $95$ and $62$ respectively. Therefore, the range of marks is
$95 - 62$
$= 33$
Hence, the correct option is $(d).$
View full question & answer→MCQ 411 Mark
Write the correct answer in the following: The range of the data: $25, 18, 20, 22, 16, 6, 17, 15, 12, 30, 32, 10, 19, 8, 11, 20$ is:
AnswerMaximum value of the variate $= 32$
And the minimum value of the variate $= 6$
Range $=$ Maximum value of the variate-Minimum value of the variate $= 32 - 6 = 26$
View full question & answer→MCQ 421 Mark
The mean weight ofa six boys in a group is $48\ kg$. The individual weights of five of them are $51\ kg, 45\ kg, 49\ kg, 46\ kg$ and $44\ kg$. The weight of the $6^{th}$ boy is:
- A
$52\ kg.$
- B
$52.8\ kg.$
- ✓
$53\ kg.$
- D
$47\ kg.$
AnswerCorrect option: C. $53\ kg.$
Let the weight of the $6^{th}$ boy be $x \ kg.$
$\frac{51+45+49+46+44+\text{x}}{6}=48$
$\Rightarrow51+45+49+46+44+\text{x}=48\times6$
$\Rightarrow235+\text{x}=288$
$\Rightarrow\text{x}=53\text{ kg}$
So, the weight of the $6^{th}$ boy is $53\ kg.$
View full question & answer→MCQ 431 Mark
For a given data, the difference between the maximum and minimum observation is known as its.
AnswerDifference between maximum and minimum value of observation is called as range.
View full question & answer→MCQ 441 Mark
The algebraic sum of the deviations of a set of $n$ values from their mean is:
Answerif is the mean of n observations $x_1, x_2, x_3, x_4 \ldots x_n$
then algebraic sum of deviations $=\sum\limits^\text{n}_{\text{i}=0}\Big(\text{x}_\text{i}-{\overline{\text{X}}}\Big)$
$=\sum\limits^\text{n}_{\text{i}=0}\text{x}_\text{i}-\text{n}{\overline{\text{X}}}$
$=\text{n}\bigg(\frac{\sum^\text{n}_{\text{i}=0}\text{x}_\text{i}}{\text{n}}\bigg)-\text{n}\overline{\text{X}}$
$=\text{n}\overline{\text{X}}-\text{n}\overline{\text{X}}$
$=0$
View full question & answer→MCQ 451 Mark
The mean of the marks scored by $50$ students was found to be $39.$ Later on it was discovered that a score of $43$ was misread as $23.$ The correct mean is:
- A
$35.6$
- ✓
$39.4$
- C
$39.8$
- D
$39.2$
AnswerCorrect option: B. $39.4$
Calculted mean of $50$ students $= 39$
$\therefore\ $Calculated sum of these numbers $= 39 × 50 = 1950$
Correct sum of these numbers $= 1950 - ($wrong term$) + ($correct term$)$
$= 1950 - 23 + 43$
$= 1970$
$\therefore\ $the corrected mean $=\frac{1970}{50}$
$=39.4$
View full question & answer→MCQ 461 Mark
If the less than ogive and the more than ogive intersect at $(32, 48),$ then the median of the data is:
AnswerIf the less than ogive and the more than ogive intersect at $(32, 48)$, then the median of the data is $32.$ Because on the graph, the point of the $x-$axis, where less than ogive and more than ogive intersects, is the median. Therefore, the Median of the data is $32.$
View full question & answer→MCQ 471 Mark
A frequency polygon is constructed by plotting frequency of the class interval and the:
- A
Upper limit of the class.
- B
Lower limit of the class.
- ✓
- D
AnswerFrequency polygon is the plot of frequencies vs. the mid values of the classes.
View full question & answer→MCQ 481 Mark
The class mark of the class $100-120$ is:
AnswerClass mark $=\frac{\text{Upper limit + lower limit}}{2}=\frac{120+100}{2}=110$
View full question & answer→MCQ 491 Mark
There are $50$ numbers. Each number is subtracted from $53$ and the difference between the mean of the numbers so obtained is found to be $-3.5.$ The mean of the given number is:
- A
$49.5$
- B
$53.5$
- ✓
$56.5$
- D
$46.5$
AnswerCorrect option: C. $56.5$
Let the mean of the initial sequence is $x.$
Given that, after subtracting $53$ from each number, the difference between the means is $3.5$
So, $x - 53 = 3.5$
Mean of the number is $x = 53 + 3.5 = 56.5$
View full question & answer→MCQ 501 Mark
In a histogram, each class rectangle is constructed with base as:
AnswerClass interval is the difference between the upper limit and lower limit of a class, also called as class width.
Hence it forms the base of the rectangle in histogram.
View full question & answer→MCQ 511 Mark
The mean of $50$ observations is $39.$ If one of the observations which was $23$ was replaced by $43,$ the resulting mean will be:
- A
$38.4$
- B
$39$
- C
$40.3$
- ✓
$39.4$
AnswerCorrect option: D. $39.4$
The mean of $50$ observations is $39.$
So sum of these $50$ observations is $50 × 39 = 1950$
After replacing the observation value $23$ by $43,$
Sum becomes $1970$
So the mean is $\frac{1970}{50}=39.4$
View full question & answer→MCQ 521 Mark
$\text{Mode}+\frac{2}{3}(\text{Mean - Mode})=$
AnswerSince, $3$ Median $=$ Mode $+\ 2$ Mean
$\Rightarrow\text{Median}=\frac{\text{Mode}}{3}+\frac{2}{3}\text{Mean}$
$=\frac{\text{Mode}}{3}+\frac{2}{3}\text{Mean}-\frac{2}{3}\text{Mode}+\frac{2}{3}\text{Mode}$
$\text{Median}=\text{Mode}+\frac{2}{3}(\text{Mean - Mode})$
View full question & answer→MCQ 531 Mark
Which one of the following is not a measure of central tendency?
AnswerMedian and Mode are the most common measures of central tendency.
These may be considered depending on the type of data and data distribution
Variance measures how far the data set is spread out and is not a measure of central tendency.
View full question & answer→MCQ 541 Mark
The median of the data $78, 56, 22, 34, 45, 54, 39, 68, 54, 84$ is:
AnswerFirst, we arrange the given observations in ascending order as follows
$22, 34, 39, 45, 54, 54, 56, 68, 78$ and $84$
Here, total number of observation, $n = 10$
Since, $n$ is even, so we use the formula for median,
Median $=\frac{\big(\frac{\text{n}}{2}\big)^{-1}\text{observation +}\big(\frac{\text{n}}{2}+1\big)\text{th observation}}{2}$
$=\frac{\big(\frac{10}{2}\big)\text{ th observation +}\big(\frac{10}{2}+1\big)\text{th observation}}{2} [$put $n = 10]$
$=\frac{5\text{th observation $+ 6th$ obsevation}}{2}=\frac{54+54}{2}=\frac{108}{2}=54$
Hence, the median of given data is $54.$
View full question & answer→MCQ 551 Mark
In a histogram, which of the following is proportional to the frequency of the corresponding class?
- ✓
- B
Perimeter of the rectangle.
- C
- D
AnswerIn, Histogram each rectangle is drawn, where width equivalent to class interval and height equivalent to the frequency of the class.
Since class interval are same across the distribution table, area of the rectangle is corresponding to frequency or height of the rectangle.
View full question & answer→MCQ 561 Mark
Write the correct answer in the following:
To draw a histogram to represent the following frequency distribution:
|
Class intervai
|
$5-10$
|
$10-15$
|
$15-25$
|
$25-45$
|
$45-75$
|
|
Frequency
|
$6$
|
$12$
|
$10$
|
$8$
|
$15$
|
The adjusted frequency for the class $25-45$ is: AnswerThe adjusted frequency for the class $25 - 45$ is
$= \frac{\text{Frequency of the class }}{\text{Class width }}\times \text{Minimum width }=\frac{8}{20} \times5=2$
View full question & answer→MCQ 571 Mark
The difference between the highest and lowest values of the observations is called:
AnswerThe difference between the highest and lowest values of the observations is called the range.
Hence, the correct choice is $(c)$
View full question & answer→MCQ 581 Mark
For the set of numbers $2, 2, 4, 5$ and $12,$ which of the following statements is true$?$
- A
Mean $=$ Median.
- ✓
Mean $>$ Mode.
- C
Mean $>$ Mode.
- D
Mode $=$ Median.
AnswerCorrect option: B. Mean $>$ Mode.
Median $= 4$
Mode $= 2$
$\text{Mean}=\frac{2+2+4+5+12}{5}=\frac{25}{5}=5$
Hence, $($Mean $= 5) > ($Mode $= 2)$
View full question & answer→MCQ 591 Mark
The following is the data of wages per day: $5, 4, 7, 5, 8, 8, 8, 5, 7, 9, 5, 7, 9, 10, 8.$ The mode of the data is:
- A
$7$ and $8$
- B
$10$ and $12$
- ✓
$5$ and $8$
- D
$8$ and $10$
AnswerCorrect option: C. $5$ and $8$
The given data is $5, 4, 7, 5, 8, 8, 8, 5, 7, 9, 5, 7, 9, 10$ and $8$
Make the frequency table.
|
Value
|
Tallybars
|
Frequency
|
|
$4$
|
$|$ |
$1$
|
|
$5$
|
$|||||$
|
$4$
|
|
$7$
|
$|||$ |
$3$
|
|
$8$
|
$||||$ |
$4$
|
|
$9$
|
$||$ |
$2$
|
|
$10$
|
$|$ |
$1$
|
Since the value $5$ and $8$ occurs in the data maximum number of times, that is, $4.$ Hence, the modal value is $5$ and $8.$ In this case the mode is not unique. View full question & answer→MCQ 601 Mark
Write the correct answer in the following:
For drawing a frequency polygon of a continous frequency distribution, we plot the points whose ordinates are the frequencies of the respective classes and abcissae are respectively:
- A
Upper limits of the classes.
- B
Lower limits of the classes.
- ✓
Class marks of the classes.
- D
Upper limits of perceeding classes.
AnswerCorrect option: C. Class marks of the classes.
Abcissac are the class marks of the classes.
View full question & answer→MCQ 611 Mark
The mean of $n$ observations is $\overline{\text{X}}.$ If each observation is multiplied by $k,$ the mean of new observations is:
- ✓
$\text{k}\overline{\text{X}}$
- B
$\frac{\overline{\text{X}}}{\text{k}}$
- C
$\overline{\text{X}}+\text{k}$
- D
$\overline{\text{X}}-\text{k}$
AnswerCorrect option: A. $\text{k}\overline{\text{X}}$
Mean$=\overline{\text{X}}=\frac{\text{Sum of all observations}}{\text{Total number of observations}}$
$=\frac{\text{Sum of all observations}}{\text{n}}$
if each observation is multiplied by $k,$ then
New Mean,$\overline{\text{X'}}=\frac{(\text{Sum of all observations})\text{k}}{\text{n}}$
$\Rightarrow\overline{\text{X}'}=\text{k}\overline{\text{X}}$
View full question & answer→MCQ 621 Mark
A frequency polygon is constructed by plotting frequency of the class interval and the:
- A
- B
Upper limit of the class.
- C
Lower limit of the class.
- ✓
AnswerA frequency polygon is a type of line graph that shows the frequency of a mutually exclusive event occurring. Seeing the data in this format helps us visualize and understand it better. All frequency polygons must have a title, $x - ax$ is, $y - ax$ is, and data points with a line connecting them.
View full question & answer→MCQ 631 Mark
The empirical relation between mean, mode and median is:
- ✓
Mode $= 3$ Median $- 2$ Mean.
- B
Mode $= 2$ Median $- 3$ Mean.
- C
Median $= 3$ Mode $- 2$ Mean.
- D
Mean $= 3$ Median $- 2$ Mode.
AnswerCorrect option: A. Mode $= 3$ Median $- 2$ Mean.
The empirical Relation between mean, median and mode is:
Mode $= 3$ Median $- 2$ mean.
View full question & answer→MCQ 641 Mark
Which of the following variables are discrete$?$
$1.$ Size of shoes.
$2.$ Number of pages in a book.
$3.$ Distance travelled by a train.
$4.$ Time.
- A
$2$ and $4$
- B
$1$ and $3$
- C
$1$ and $4$
- ✓
$1$ and $2$
AnswerCorrect option: D. $1$ and $2$
Discrete variables are variables that can only take finite values.
Size of shoes $\&$ pages in the book have finite number.
View full question & answer→MCQ 651 Mark
In the following distribution:
|
Wages(in Rs)
|
No of workers
|
|
More than $140$
|
$12$
|
|
More than $130$
|
$27$
|
|
More than $120$
|
$60$
|
|
More than $110$
|
$105$
|
|
More than $100$
|
$124$
|
|
More than $90$
|
$141$
|
|
More than $80$
|
$150$
|
The number of workers having wage range $($in $Rs.) 110-120$ is: Answer
|
Wages(in Rs)
|
No of workers
|
|
$140–150$
|
$12$
|
|
$130–140$
|
$15$
|
|
$120–130$
|
$33$
|
|
$110–120$
|
$45$
|
|
$100–90$
|
$19$
|
|
$90–100$
|
$17$
|
|
$80–90$
|
$9$
|
Therefore, the number of workers having a wage range $($in Rs.$) 110-120$ is $45$ View full question & answer→MCQ 661 Mark
If the arithmetic mean of $7, 5, 13, x$ and $9$ is $10,$ then the value of $x$ is:
AnswerThe given data is $7, 5, 13, x$ and $9.$ They are $5$ in numbers.
The mean is $\frac{7+5+13+\text{x}+9}{5}=\frac{34+\text{x}}{5}$
But, it is given that the mean is $10$. Hence, we have
$\frac{34+\text{x}}{5}=10$
$⇒ 34 + x = 50$
$⇒ x = 50 - 34$
$⇒ x = 16$
View full question & answer→MCQ 671 Mark
The graph given below shows the frequency distribution of the age of $22$ teachers in a school. The number of teachers whose age is less than $40$ years is:
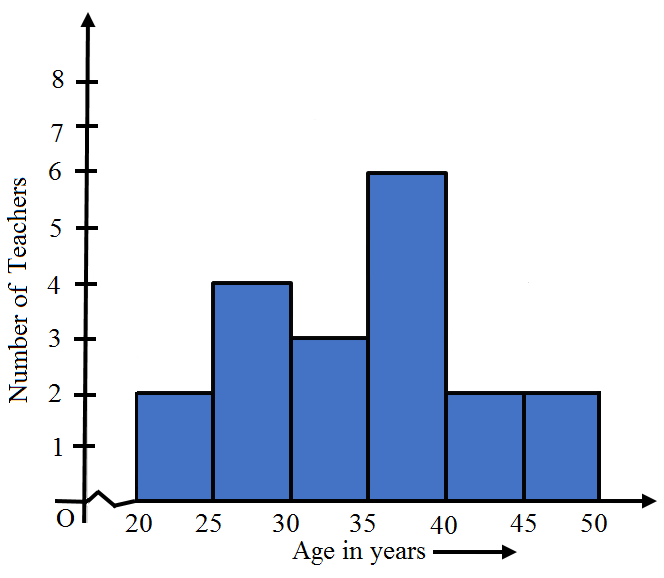
AnswerAdd the values corresponding to the height of the bar before $40.$
$6 + 3 + 4 + 2 = 15$
View full question & answer→MCQ 681 Mark
The range of the data $12, 25, 15, 18, 17, 20, 22, 6, 16, 11, 8, 19, 10, 30, 20, 32$ is:
AnswerDifference between the maximum & minimum value of the observation is called as range.
So, $32 - 6 = 26$
View full question & answer→MCQ 691 Mark
Write the correct answer in the following: The width of five continuous classes in a frequency distribution is $5$ and the lower class-limit of the lowest class is $10.$ The upper class-limit of the highest class is:
AnswerSol. Width of each of the five continuous classes in a frequency distribution is $5.$
Lower class limit of the lowest class $= 10$
Upper class limit of the lowest class is $10 + 5 = 15$
So, the five continuous classes are
$10 - 15, 15 - 20, 20 - 25, 25 - 30, 30 - 35$
Hence, the upper-class limit of the height class is $35.$
View full question & answer→MCQ 701 Mark
In a grouped frequency distribution, the class intervals are $0-10, 10-20, 20-30,...$ then the class width is:
AnswerThe class width is the difference between the upper- or lower-class limits of consecutive classes. In this case, class width equals to the difference between the lower limits of the first two classes.
$w = 10 - 0$
So, the class width is $10$
View full question & answer→MCQ 711 Mark
Write the correct answer in the following:In the class intervals $10–20, 20–30,$ the number $20$ is included in:
AnswerCorrect option: B. $20–30$
The number $20$ is included in $20–30.$
Hence, $(b)$ is the correct answer.
View full question & answer→MCQ 721 Mark
Which of the following variables are discrete?
$A.$ Size of shoes.
$B.$ Number of pages in a book.
$C.$ Distance travelled by a train.
$D.$ Time.
- A
$B$ and $D$
- ✓
$A$ and $B$
- C
$A$ and $C$
- D
$A$ and $D$
AnswerCorrect option: B. $A$ and $B$
Discrete variables are variables that can only take finite values.
Size of shoes and pages in the book have a finite number.
View full question & answer→MCQ 731 Mark
The class marks of a frequency distribution are as given below: $38, 43, 48, 53, 58.$ The class corresponding to the class mark $43$ is:
- A
$38 - 48$
- ✓
$40.5 - 45.5$
- C
$38.5 - 48.5$
- D
$35.5 - 45.5$
AnswerCorrect option: B. $40.5 - 45.5$
As the class size $= 5,$ Class interval is got by subtracting and adding $2.5$ to $43.$
View full question & answer→MCQ 741 Mark
Let $m$ be the mid-point and $l$ be the upper class limit of a class in a continuous frequency distribution. The lower class limit of the class is:
- A
$2m + I$
- B
$2I - m$
- ✓
$2m - I$
- D
$m - I$
AnswerCorrect option: C. $2m - I$
Let the lower limit $= k$
Mid-point $= m$
Upper limit $= l$
Mid-point $=\frac{\text{(upper limit + lower limit)}}{2}$
$\text{m}=\frac{(\text{k+l})}{2}$
$2\text{m}=\text{k}+\text{l}$
$\text{k}=2\text{m}-\text{l}$
Therefore, lower limit $= 2m - l$
View full question & answer→MCQ 751 Mark
To represent the more than type graphically, we plot the $...........$ on the $x-$axis.
AnswerThe lower limit for every class is the smallest value in that class on the other hand the upper limit for every class is the greatest value in that class.
To represent $'t$he more than type$’$ graphically, we plot the lower limits on the $x-$axis and cumulative frequency on the $y-$axis to find the median.
View full question & answer→MCQ 761 Mark
The mean of six numbers is $23.$ If one of the numbers is excluded, the mean of the remaining numbers becomes $20.$ The excluded number is:
AnswerThe mean of the six numbers is $23.$
So the sum of six numbers is $23 × 6 = 138$
After excluding one number, the mean of the remaining numbers is $20.$
So the sum of five numbers is $20 × 5 = 100$
The difference between them is$138 - 100 = 38$
View full question & answer→MCQ 771 Mark
The following observations have been arranged in an ascending order: $18, 20, 25, 26, 30, x, 37, 38, 39, 48$. If the median of the data is $35,$ then the value of $x$ is:
AnswerThe median is the middle score for a set of data that has been arranged in ascending or descending order of magnitude.
for even number of observations, median is calculated as average of two middle number.
for the given example $30$ and $x$ are in the middle and median is $35.$
So,
$35=\frac{30+\text{x}}{2}$
$70=30+\text{x}$
$\text{x}=40$
View full question & answer→MCQ 781 Mark
The number of times a particular item occurs in a given data is called its.
AnswerThe number of times a particular item occurs in a given data is called its Frequency.
View full question & answer→MCQ 791 Mark
The median of the data arranged in ascending order $8, 9, 12, 18, (x + 2), (x + 4), 30, 31, 34, 39$ is $24.$ The value of $x$ is:
AnswerThe given data is in ascending order.
Here, $n$ is $10,$ which is an even number. Thus, we have:
Median $=$ mean of $\Big(\frac{\text{n}}{2}\Big)\text{th}$ and $\Big(\frac{\text{n}}{2}+1\Big)\text{th}$ observations $=\frac{1}{2}$ $(5th$ observation $+\ 6th$ observation$)$
$=\frac{1}{2}(\text{x}+2+\text{x}+4)=(\text{x}+3)$
$= 24$
Also, $x + 3 = 24$
$⇒ x = 21$
View full question & answer→MCQ 801 Mark
The mean of five observations is $15.$ If the mean of first three observations is $14$ and that of last three is $17$, then the third observation is:
AnswerThe mean of five observations is $15$
So the sum of these five observations is $15 × 5 = 75$
The mean of first three observations is $14$
So the sum of the first three observations is $14 × 3 = 42$
So the sum of the last two numbers is $75 - 42 = 33$
The mean of the last three observations is $17.$
So sum of last three observations is $17 × 3 = 51$
So the middle number is $51 - 33 = 18.$
View full question & answer→MCQ 811 Mark
The mode of $4, 6, 7, 8, 12, 11, 13, 9, 13, 9, 7, 8, 9$ is:
AnswerIn statistics, the mode in a list of numbers refers to the integers that occurs most number of times.
for the set of numbers, $9$ occurs three times i.e more than any other number in the list.
View full question & answer→MCQ 821 Mark
Observe the table given below and choose the correct alternative: The class mark for $R$ is:
|
Column
|
$P$
|
$Q$
|
$R$
|
$S$
|
$T$
|
$E$
|
|
Marks scored
|
$30-40$
|
$40-50$
|
$50-60$
|
$6-70$
|
$70-80$
|
$80-90$
|
|
Number if students
|
$4$
|
$8$
|
$12$
|
$10$
|
$7$
|
$4$
|
AnswerClass mark $=\frac{\text{( upper limit + Lower limit ) }}{2}$
$=\frac{50+60}{2}$
$=\frac{110}{2}$
So class mark is $55.$
View full question & answer→MCQ 831 Mark
The numbers $2, 3, 4, 4, 2x + 1, 7, 7, 8$ and $9$ are written in an ascending order. If the median is $7,$ then mode of this data is:
AnswerThe median is the middle score for a set of data that has been arranged in ascending or descending order of magnitude.
Since $2x + 1$ is in the middle of the arranged numbers, so it is median
Hence, $2x + 1 = 7$
Now since $7$ occurs more number of times then other numbers so mode of the list is $7.$
View full question & answer→MCQ 841 Mark
For drawing a frequency polygon of a continuous frequency distribution, we plot the points whose ordinates are the frequency of respective classes and abscissa are respectively:
- ✓
Class marks of the classes.
- B
Lower limits of the classes.
- C
Upper limits of the classes.
- D
Upper limits of preceeding classes.
AnswerCorrect option: A. Class marks of the classes.
Frequency polygon is the line graph plotted with class marks on $x-$axis $\&$ frequency of the class on $y-$axis.
View full question & answer→MCQ 851 Mark
In a bar graph if $1\ cm$ represents $30\ km$, then the length of bar needed to represent $75\ km$ is:
- A
$2\ cm$
- B
$3\ cm$
- C
$3.5\ cm$
- ✓
$2.5\ cm$
AnswerCorrect option: D. $2.5\ cm$
$1\ cm = 30\ km$
So for $75\ km$
$\frac{75}{30}=2.5\text{cm}$
View full question & answer→MCQ 861 Mark
Sheila received $x$ marks in two of her tests and $y$ marks in three other tests. Her average score in all the five tests in terms of $x$ and $y$ is:
- A
$\frac{3\text{x}+2\text{y}}{5}$
- ✓
$\frac{2\text{x}+3\text{y}}{5}$
- C
$\frac{2\text{x}+3\text{y}}{2}$
- D
$\frac{3\text{x}+2\text{y}}{3}$
AnswerCorrect option: B. $\frac{2\text{x}+3\text{y}}{5}$
Average is equal to the sum of all the values in the data set divided by the number of values in the data set.
Average $=\frac{\text{x}+\text{x}+\text{y}+\text{y}+\text{y}}{5}$
Average $=\frac{2\text{x}+3\text{y}}{5}$
View full question & answer→MCQ 871 Mark
The mean of a set of seven numbers is $81$. If one of the numbers is discarded, the mean of the remaining numbers is $78$. The value of discarded number is:
AnswerGiven that the mean of $7$ numbers is $81$. Let us denote the numbers by $X_1, \ldots . X_7$
If $\overline{\text{X}}$ be the mean of the n observations $X_1, \ldots X_n$, then we have
$\overline{\text{X}}=\frac{1}{2}\sum_{\text{i}=1}^{\text{n}}\text{x}_\text{i}$
$\Rightarrow\sum_{\text{i}=1}^{\text{n}}\text{x}_\text{i}=\text{n}\overline{\text{X}}$
Hence the sum of $7$ numbers is
$\sum_{\text{i}=1}^{7}\text{x}_\text{i}=7\times81=567$
If one number is discarded then the mean becomes $78$ and the total numbers become $6.$
Let the number discarded is $x.$
After discarding one number the sum becomes $567 - x $ and then the mean is
$\frac{567-\text{x}}{6}$
But it is given that after discarding one number the mean becomes $78.$
Hence we have
$\frac{567-\text{x}}{6}=78$
$\Rightarrow 567 - x = 468$
$\Rightarrow 567 = x + 468$
$\Rightarrow x = 468 = 567$
$\Rightarrow x = 567 - 468$
$\Rightarrow x = 99$
Thus the excluded number is $99.$
View full question & answer→MCQ 881 Mark
If the mean of five observations $x, x + 2, x + 4, x + 6, x + 8,$ is $11,$ then the mean of first three observations is:
AnswerMean of first five observations $=\frac{\text{x}+\text{x}+2+\text{x}+4+\text{x}+6+\text{x}+8}{5}=11$
$⇒ 5x + 20 = 55$
$⇒ x = 7$
$⇒$ First three numbers are $7, 9, 11$
$\text{Mean}=\frac{7+9+11}{3}=\frac{27}{3}=9$
View full question & answer→MCQ 891 Mark
Write the correct answer in the following: A grouped frequency distribution table with classes of equal sizes using $63-72 (72$ included$)$ as one of the class is constructed for the following data: $30, 32, 45, 54, 74, 78, 108, 112, 66, 76, 88, 40, 14, 20, 15, 35, 44, 66, 75, 84, 95, 96, 102, 110, 88, 74, 112, 14, 34, 44.$ The number of classes in the distribution will be:
AnswerMinimum value $= 14$
Maximum value $= 112$
The classes are
$13 - 22, 23 - 32, 33 - 42, 43 - 52, 53 - 62, 63 - 72, 73 - 82, 83 - 92, 93 - 102$ and $103 - 112.$
The number of classes in the distribution will be $10.$
View full question & answer→MCQ 901 Mark
The mean of $50$ observations is $39.$ If one of the observations which was $23$ was replaced by $43,$ the resulting mean will be:
- A
$40.3$
- ✓
$39.4$
- C
$38.4$
- D
$39$
AnswerCorrect option: B. $39.4$
The mean of $50$ observations is $39.$
So sum of these $50$ observations is $50 × 39 = 1950$
After replacing the observation value $23$ by $43,$
Sum becomes $1970$
So the mean is $\frac{1970}{50}=39.4$
View full question & answer→MCQ 911 Mark
The mean of the following data is $8.$
| $x$ |
$3$ |
$5$ |
$7$ |
$9$ |
$11$ |
$13$ |
| $y$ |
$6$ |
$8$ |
$15$ |
$p$ |
$8$ |
$4$ |
Then, the value of $p$ is: AnswerFor calculating the mean, we prepare the table below:
| $x_i$ |
$f_i$ |
$x_i \times f_i$ |
| $3$ |
$6$ |
$18$ |
| $5$ |
$8$ |
$40$ |
| $7$ |
$15$ |
$105$ |
| $9$ |
$p$ |
$9p$ |
| $11$ |
$8$ |
$88$ |
| $13$ |
$4$ |
$52$ |
| |
$\sum\text{f}_\text{i}=(41+\text{p})$ |
$\sum(\text{x}_\text{i}\times\text{f}_\text{i})=(303+9\text{p})$ |
Mean $=\frac{\sum(\text{x}_\text{i}\times\text{f}_\text{i})}{\sum\text{f}_\text{i}}=\frac{303+9\text{p}}{41+\text{p}}$
But mean $= 8$
$=\frac{303+9\text{p}}{41+\text{p}}=8$
$\Rightarrow303+9\text{p}=8(41+\text{p})$
$\Rightarrow303+9\text{p}=328+8\text{p}$
$\Rightarrow\text{p}=25$ View full question & answer→MCQ 921 Mark
Let $\bar{x}$ be thae mean of $x_1, x_2, \ldots . ., x_n$, and $\bar{y}$ the mean of $y_1, y_2, \ldots, y_n$. If $\bar{z}$ is the mean of $x_1, x_2, \ldots, x_n, y_1, y_2, \ldots, y n$, then $\bar{z}$ is equal to:
- A
$\bar{\text{x}}+\bar{\text{y}}$
- ✓
$\frac{\bar{\text{x}}+\bar{\text{y}}}{2}$
- C
$\frac{\bar{\text{x}}+\bar{\text{y}}}{\text{n}}$
- D
$\frac{\bar{\text{x}}+\bar{\text{y}}}{2\text{n}}$
AnswerCorrect option: B. $\frac{\bar{\text{x}}+\bar{\text{y}}}{2}$
We have $\bar{\text{x}}$ is the mean of $x_1, x_2, \ldots ., x_n$, and $\bar{y}$ is the mean of $y_1, y_2, \ldots, y_n$
So, $\bar{\text{x}}=\frac{(\text{x}_1+\text{x}_2+\text{x}_3+\ ....\ +\text{x}_\text{n})}{\text{n}}$
$\Rightarrow\text{x}_1+\text{x}_2+\text{x}_3+\ .....\ +\text{x}_\text{n}=\text{n}\bar{\text{x}}$
And $\bar{\text{y}}=\frac{(\text{y}_1+\text{y}_2+\text{y}_3+\ ....\ +\text{y}_\text{n})}{\text{n}}$
$\Rightarrow\text{y}_1+\text{y}_2+\text{y}_3+\ ....\ +\text{y}_\text{n}=\text{n}\bar{\text{y}}$
If $\bar{\text{z}}$ is the mean of $x_1, x_2, ...., y_1, y_2, , ... , y_n$
$\overline{ z }=\frac{ n \overline{ x }+ n \overline{ y }}{ n + n }=\frac{ n (\overline{ x }+\overline{ y })}{2 n }=\frac{\overline{ x }+\overline{ y }}{2}$
View full question & answer→MCQ 931 Mark
The difference between the upper and the lower class limits is called:
AnswerThe difference between the upper and the lower class limits is called the class size.
Hence, the correct choice is $(b).$
View full question & answer→MCQ 941 Mark
The mean of $a, b, c, d$ and e is $28.$ If the mean of $a, c,$ and e is $24$, What is the mean of $b$ and $d?$
Answer$\text{Mean}=\frac{\text{a}+\text{b}+\text{c}+\text{d}+\text{e}}{5}=28$
$⇒ a + b + c + d + e = 140 ...(1)$
Also, $\text{Mean}=\frac{\text{a}+\text{c}+\text{e}}{3}=24$
$⇒ a+ c + e = 72 ...(2)$
Subtracting equation $(2)$ from $(1),$ we have
$b + d = 68$
$\text{Mean}=\frac{\text{b}+\text{d}}{2}=\frac{68}{2}=34$
View full question & answer→MCQ 951 Mark
Write the correct answer in the following: The mean of $25$ observations is $36$. Out of these observations if the mean of first $13$ observations is $32$ and that of the last $13$ observations is $40$, the $13^{th}$ observation is:
AnswerMean of first $13$ observation $= 32$
$\therefore$ Sum of all first $13$ observation $= (32 \times 13) = 416$
Mean of last $13$ observation $= 40$
$\therefore$ Sum of all last $13$ observation $= (40 \times 13) = 520$
Mean of $25$ observation $= 36$
$\therefore$ Sum of all first $25$ observation $= (36 \times 25) = 900$
Hence, $13^{th}$ observation $= 416 + 520 - 900 = 36$
View full question & answer→MCQ 961 Mark
If each observation of the data is increased by $3,$ then their mean:
AnswerCorrect option: B. Is increased by $3.$
Since mean is equal to the sum of all the values in the data set divided by the number of values in the data set.
So increase in the value of each observation will also increase the mean (average) by $3.$
View full question & answer→MCQ 971 Mark
If $\text{x}$ represents the mean of observations $x_1, x_2 \ldots ., x_n, $ then value of $\displaystyle\sum_{\text{i=1}}^{\text{n}}\big(\text{x}_\text{i}-\text{x}\big)$ is.
AnswerSince mean is equal to the sum of all the values in the data set divided by the number of values in the data set also called as average.
Hence, sum of difference of all the numbers $\&$ mean value will be zero.
View full question & answer→MCQ 981 Mark
If $\bar{\text{x}}$ is the mean of $x_1, x_2, x_3, \ldots, x_n$ then $\sum\limits_{\text{i}=1}^\text{n}(\text{x}_\text{i}-\bar{\text{x}})=?$
AnswerGiven that $\bar{\text{x}}$ is the mean of $x_1, x_2, x_3, \ldots, x_n$
$\Rightarrow\frac{\text{x}_1+\text{x}_2+\text{x}_3+_{\dots}+\text{x}_\text{n}}{\text{n}}=\bar{\text{x}}$
$\Rightarrow\text{x}_1+\text{x}_2+\text{x}_3+_{\dots}+\text{x}_\text{n}=\text{n }\bar{\text{x}}\ \dots\text{(i)}$
Consider,
$\big(\text{x}_1-\bar{\text{x}}\big)+\big(\text{x}_2-\bar{\text{x}}\big)+\big(\text{x}-\bar{\text{x}}\big)+_{\dots}+\big(\text{x}_\text{n}-\bar{\text{x}}\big)$
$=\big(\text{x}_1+\text{x}_2+\text{x}_3+_{\dots}+\text{x}_\text{n}\big)-\text{n }\bar{\text{x}}$
$=\text{n}\bar{\text{x}}-\text{n}\bar{\text{x}}\ \dots($from $(i))$
$=0$
View full question & answer→MCQ 991 Mark
The median for the digits $1, 2, 3, … 9$ is:
AnswerThe median is the middle score for a set of data that has been arranged in ascending or descending order of magnitude.
So for numbers $1, 2, 3, ... 9$
$5$ is the median.
View full question & answer→MCQ 1001 Mark
The following is the data of wages per day $: 5, 4, 7, 5, 8, 8, 8, 5, 7, 9, 5, 7, 9, 10, 8$ The mode of the data is:
- A
$7$
- B
$5$
- C
$8$
- ✓
$(B)$ and $(C)$ both
AnswerCorrect option: D. $(B)$ and $(C)$ both
In data $5, 4, 7, 5, 8, 8, 8, 5, 7, 9, 5, 7, 9, 10, 8,$
We observe that values $5$ and $8$ both have maximum frequency i.e. $4$
View full question & answer→MCQ 1011 Mark
The weight of $10$ students $($in kg$)$ are: $55, 40, 35, 52, 60, 38, 36, 45, 31, 44.$ The median weight is.
- A
$41kg$
- ✓
$42kg$
- C
$44kg$
- D
$40kg.$
AnswerCorrect option: B. $42kg$
Arranging the numbers in ascending order, we have:
$31, 35, 36, 38, 40, 44, 45, 52, 55, 60$
Here, $n$ is $10,$ which is an even number. Thus, we have:
Median $=$ Mean of $\Big(\frac{\text{n}}{2}\Big)\text{th}$ obervation & $\Big(\frac{\text{n}}{2}+1\Big)\text{th}$ obervation Median Weight $=$ mean of the weights of $\Big(\frac{10}{2}\Big)\text{th}$ student & $\Big(\frac{10}{2}+1\Big)\text{th}$ student $=$ mean of the weights of $5th$ student & $6th$ student$=\frac{1}{2}(40+44)=42$
Hence, the median weight is $42kg.$
View full question & answer→MCQ 1021 Mark
An ogive is used to determine:
AnswerAn ogive is used to determine how many data values lie above or below a particular value in a data set.
In other words, it is used to determine the Median of a grouped data.
View full question & answer→MCQ 1031 Mark
If $\bar{\text{x}}$ is the mean of $x_1, x_2, \ldots, x_n$ then for $\text{a}\neq0,$ the mean $ax, ax_2, ..., axn,\frac{\text{x}_1}{\text{a}},\frac{\text{x}_2}{\text{a}},\ \dots,\frac{\text{x}_\text{n}}{\text{a}}$ is:
- A
$\Big(\text{a}+\frac{1}{\text{a}}\Big)\bar{\text{x}}$
- ✓
$\Big(\text{a}+\frac{1}{\text{a}}\Big)\frac{\bar{\text{x}}}{2}$
- C
$\Big(\text{a}+\frac{1}{\text{a}}\Big)\frac{\bar{\text{x}}}{\text{n}}$
- D
$\frac{\Big(\text{a}+\frac{1}{\text{a}}\Big)\bar{\text{x}}}{2\text{n}}$
AnswerCorrect option: B. $\Big(\text{a}+\frac{1}{\text{a}}\Big)\frac{\bar{\text{x}}}{2}$
Required mean $=\frac{(\text{ax}_1+\text{ax}_2+_{\dots}+\text{ax}_\text{n})+(\frac{\text{x}_1}{\text{a}},\frac{\text{x}_2}{\text{a}},\ \dots,\frac{\text{x}_\text{n}}{\text{a}})}{2\text{n}}$
$=\frac{1}{2}\bigg[\frac{\text{a}(\text{x}_1+\text{x}_2+{\dots}+\text{x}_\text{n})}{\text{n}}+\frac{\frac{1}{2}(\text{x}_1+\text{x}_2+{\dots}+\text{x}_\text{n})}{\text{n}}\bigg]$
$=\frac{1}{2}\Big[\text{a}\bar{\text{x}}+\frac{1}{\text{a}}\bar{\text{x}}\Big]$
$=\Big[\text{a}+\frac{1}{\text{a}}\Big]\frac{\bar{\text{x}}}{2}$
View full question & answer→MCQ 1041 Mark
What is the upper limit of the interval: $20 - 23?$
AnswerMaximum value of an interval is called the upper limit.
View full question & answer→MCQ 1051 Mark
Given the class intervals $0-10, 10-20, 20-30,…$ then $10$ is considered in class:
- A
$0-10$
- ✓
$10-20$
- C
$0-20$
- D
$10-30$
AnswerCorrect option: B. $10-20$
As the classes are continuous, the upper limits do not include in that particular class.
View full question & answer→MCQ 1061 Mark
If the arithmetic mean of $7, 5, 13, x$ and $9$ is $10,$ then the value $x$ is:
Answer$\text{Mean}=\frac{7+5+13+\text{x}+9}{5}=10$
$\Rightarrow34+\text{x}=50$
$\Rightarrow\text{x}=16$
View full question & answer→MCQ 1071 Mark
The empirical relationship between the three measures of central tendencies is:
- A
$3$ mode $=$ mean $+\ 2$ median
- ✓
Mode $= 3$ median $-\ 2$ mean
- C
- D
$3$ mean $=$ median $+\ 2$ mode
AnswerCorrect option: B. Mode $= 3$ median $-\ 2$ mean
The empirical relationship between the three measures of central tendencies is $3$ Median $=$ Mode $+\ 2$ Mean.
The relationship is as per observation. A distribution in which the values of mean, median and mode coincide $($i.e., mean $=$ median $=$ mode$)$ is called symmetrical
Distribution. conversely, when the values of mean, median, mode are not equal, the distribution is called asymmetrical or skewed.
Knowing any two values, the third can be computed by this formula
$3$ median $= 2$ mean $+$ mode
$2$ mean $= 3$ median $–$ mode
$\text{Mean}=\frac{1}{2}(3 \text{ median - mode})$
View full question & answer→MCQ 1081 Mark
In an examination, ten students scored the following marks: $60, 58, 90, 51, 47, 81, 70, 95, 87, 99.$ The range of this data is.
AnswerDifference between the maximum and minimum value of the observation is called as range.
So, $99 - 47 = 52$
View full question & answer→MCQ 1091 Mark
If $x_1, x_2, x_3, \ldots . x n$ are the means of $n$ groups with $n_1, n_2, \ldots n_i$ number of observations respectively, then the mean $x$ of all the groups taken together is:
- A
$\displaystyle\sum_{\text{i=1}}^{\text{n}}\text{n}_\text{i}\text{x}_\text{i}$
- B
$\frac{\displaystyle\sum_{\text{i=1}}^{\text{n}}\text{n}_\text{i}\text{x}_\text{i}}{2\text{n}}$
- ✓
$\frac{\displaystyle\sum_{\text{i=1}}^{\text{n}}\text{n}_\text{i}\text{x}_\text{i}}{\displaystyle\sum_{\text{i=1}}^{\text{n}}\text{n}_\text{i}}$
- D
$\frac{\displaystyle\sum_{\text{i=1}}^{\text{n}}\text{n}_\text{i}\text{x}_\text{i}}{\text{n}^2}$
AnswerCorrect option: C. $\frac{\displaystyle\sum_{\text{i=1}}^{\text{n}}\text{n}_\text{i}\text{x}_\text{i}}{\displaystyle\sum_{\text{i=1}}^{\text{n}}\text{n}_\text{i}}$
The mean is equal to the sum of all the values in the data set divided by the number of values in the data set.
View full question & answer→MCQ 1101 Mark
The class size of a distribution is $25$ and the first class interval is $200-224.$ Then, the class marks of first two class intervals are:
- A
$212, 262$
- B
$237, 262$
- C
$237, 287$
- ✓
$212, 237$
AnswerCorrect option: D. $212, 237$
For $1st$ class mark
Class mark $=\frac{\text{(upper limit +lower limit)}}{2}$
$1st$ class mark $= 212$
Add the class size to get the class mark of the next class
$2nd$ class mark $= 212 + 25$
$2nd$ class mark $= 237$
Hence, the class mark of first two intervals are $212$ and $237.$
View full question & answer→MCQ 1111 Mark
Find the range of the following data: $25, 20 30, 18, 16, 15:$
AnswerThe difference between the maximum and minimum value is called range.
Thus, $30 - 15 = 15$
View full question & answer→MCQ 1121 Mark
Write the correct answer in the following: The median of the data $78, 56, 22, 34, 45, 54, 39, 68, 54, 84$ is:
AnswerArranging the data in ascending order, we get
$22, 34, 39, 45, 54, 56, 78, 84$
Here $n = 9$, which is an odd number.
$\therefore\ \text{Median}=\Big(\frac{\text{n}+1}{2}\Big)^{\text{th}}$
$\text{Value}=\Big(\frac{9+1}{2}\Big)^{\text{th}}$
$\text{value}=5^{\text{th}}\text{value}$
So, median $= 54$
View full question & answer→MCQ 1131 Mark
The runs scored by $11$ members of a cricket team are. $15, 34, 56, 27, 43, 29, 31, 13, 50, 20, 0$. The median score is:
AnswerArranging the weight of $10$ students in ascending order, we have:
$0, 13, 15, 20, 27, 29, 31, 34, 43, 50, 56$
Here, $n$ is $11$, which is an odd number. Thus, we have:
Median = Value of $\bigg(\frac{\text{n}+1}{2}\bigg)\text{th}$ observation median score
= Value of $\bigg(\frac{11+1}{2}\bigg)\text{th}$ term
= Value of $6\ th$ term
= $29$
View full question & answer→MCQ 1141 Mark
The range of the data: $25, 18, 20, 22, 16, 6, 17, 15, 12, 30, 32, 10, 19, 8, 11, 20$ is:
AnswerRange $= 32 - 6 = 26$
View full question & answer→MCQ 1151 Mark
The algebraic sum of the deviations of a set of n values from their mean is:
AnswerIf $\overline{\text{X}}$ be the mean of the n observations $q x_1, \ldots . x_n$ Then we have
$\overline{\text{X}}=\frac{1}{\text{n}}\sum\limits_{\text{i}=1}^{\text{n}}\text{X}_\text{i}$
$\Rightarrow\sum\limits_{\text{i}=1}^{\text{n}}\text{X}_\text{i}=\overline{\text{X}}$
Let $\overline{\text{X}}$ be the mean of n Values $x_i, \ldots . x_n$. so we have
$\overline{\text{X}}=\frac{1}{\text{n}}\sum\limits_{\text{i}=1}^{\text{n}}\text{X}_\text{i}$
$\Rightarrow\sum\limits_{\text{i}=1}^{\text{n}}\text{X}_\text{i}=\text{n}\overline{\text{X}}$
The sum of the deviations of n values $x_i, \ldots . x_n$ from their mean $\overline{\text{X}}$ is
$(\text{x}_1-\overline{\text{X}})+(\text{x}_2-\overline{\text{X}})+.....+(\text{x}_\text{n}-\overline{\text{X}})$
$=\sum\limits_{\text{i}=1}^{\text{n}}(\text{x}_\text{i}-\overline{\text{X}})$
$=\sum\limits_{\text{i}=1}^{\text{n}}\text{x}_\text{i}-\sum\limits_{\text{i}=1}^{\text{n}}\overline{\text{X}}$
$=\text{n}\overline{\text{X}}-\text{n}\overline{\text{X}}$
$=0$
View full question & answer→MCQ 1161 Mark
Find the median of the given data: $7, 8, 7, 7, 9, 10, 13$.
AnswerMedian is the value separating the higher half of the data sample from the lower half.
Arrange the given data in ascending order.
Value of the middle term is the median of the given data sample.
$7, 7, 7, 8, 9, 10, 13$
Since 8 is in the centre so $8$ is the median.
View full question & answer→MCQ 1171 Mark
The median of the following data : $0, 2, 2, 2, -3, 5, -1, 5, −3, 6, 6, 5, 6$ is:
AnswerData: $0, 2, 2, 2, -3, 5, -1, 5, 5, -3, 6, 6, 5, 6$
Rearranging data in increasing order, we have
$-3, -3, -1, 0, 2, 2, 5, 5, 5, 5, 6, 6, 6$
Number of observations $= n = 14$ (even)
Now,
$\text{Median}=\frac{\Big(\frac{\text{n}}{2}\Big)^{\text{th}}\text{observation}+\Big(\frac{\text{n}+1}{2}\Big)^{\text{th}}\text{observation}}{2}$
$=\frac{7^{\text{th}}\text{observation}+8^{\text{th}}\text{observation}}{2}$
$=\frac{2+5}{2}$
$\Rightarrow\text{Median}=3.5$
View full question & answer→MCQ 1181 Mark
The difference between the upper and the lower class limits is called:
AnswerThe difference between the upper class limit and the lower class limit is called class size.
View full question & answer→MCQ 1191 Mark
Which of the following variables are discrete?
$A.$ Size of shoes.
$B.$ Number of pages in a book.
$C.$ Distance travelled by a train.
$D.$ Time.
- A
$A$ and $D$
- ✓
$A$ and $B$
- C
$B$ and $D$
- D
$A$ and $C$
AnswerCorrect option: B. $A$ and $B$
Discrete variables are variables that can only take finite values.
Size of shoes and pages in the book have a finite number.
View full question & answer→MCQ 1201 Mark
The mean of first four prime numbers is:
AnswerCorrect option: D. $4.25$
The mean is equal to the sum of all the values in the data set divided by the number of values in the data set.
The first $4$ prime numbers are $2, 3, 5, 7$
So, mean is $\frac{17}{4}=4.25$
View full question & answer→MCQ 1211 Mark
A grouped frequency distribution table with classes of equal sizes using $105-120$ ($120$ not included) as one of the class intervals is constructed for the following data: The number of classes in the distribution will be:
|
$125$
|
$126$
|
$140$
|
$98$
|
$128$
|
$78$
|
$108$
|
$67$
|
|
$87$
|
$149$
|
$102$
|
$136$
|
$145$
|
$112$
|
$103$
|
$84$
|
|
$123$
|
$130$
|
$120$
|
$89$
|
$103$
|
$65$
|
$96$
|
$65$
|
AnswerMaximum value of the observation is $149$ & minimum value is $65$.
This range of data need to grouped into classes of equal sizes with $105-120$ as one class.
Thus we need to construct classes of width $15$.
Below $6$ classes can be constructed
$60-75, 75-90, 90-105, 105-120, 120-135, 135-150$
View full question & answer→MCQ 1221 Mark
Less than' cumulative frequency table for a given data is as follows. Then, the frequency of class interval $20-30$ is:
|
Marks
|
Less than $10$
|
Less than $20$
|
Less than $300$
|
Less than $40$
|
|
Cumulative frequency
|
$3$
|
$17$
|
$37$
|
$92$
|
AnswerA cumulative frequency distribution is the sum of the class and all classes below it in a frequency distribution.
Less than $30$ has the class interval 20-30. Frequency of this class interval will be corresponding to
|
Marks
|
Cumulative Frequency
|
Class
|
Frequency
|
|
Less than $10$
|
$3$
|
$1-10$
|
$3$
|
|
Less than $20$
|
$17$
|
$10-20$
|
$14$
|
|
Less than $30$
|
$37$
|
$20-30$
|
$20$
|
|
Less than $40$
|
$92$
|
$30-40$
|
$55$
|
$37 - 17 = 20$ View full question & answer→MCQ 1231 Mark
Tally are usually marked in a bunch of:
AnswerTally are usually marked in a bunch of $5 : 4$ in a vertical line and one is placed diagonally.
View full question & answer→MCQ 1241 Mark
One of the sides of a frequency polygon is:
- A
Neither of the coordinate axes.
- ✓
The $x$-axis.
- C
Either of the coordinate axes.
- D
The $y$-axis.
AnswerCorrect option: B. The $x$-axis.
In frequency polygon $x$-axis repesents data value whereas $y$-axis is used represent the frequencies of the data.
We include one class below lowest value and one class above highest value with zero frequencies.
The graph touches the $x$-axis at these points.
So, one sides of the frequency polygon is $x$-axis.
View full question & answer→MCQ 1251 Mark
If each observation of the data is increased by $5$, then their mean.
AnswerCorrect option: B. Is increased by $5$.
Is increased by $5$.
Then old mean $x$ old $=\frac{\displaystyle\sum_{\text{i}=1}^{\text{n}}\text{x}_{\text{i}}}{\text{n}}$
Now, adding $5$ in each observation, the new mean becomes
$\overline{\text{x}}_\text{New}=\frac{(\text{x}_1+5)+(\text{x}_2+5)+....+(\text{x}_\text{n}+5)}{\text{n}}$
$\Rightarrow\overline{\text{x}}_\text{New}=\frac{(\text{x}_1 + \text{x}_2+....+\text{x}_\text{n})+5\text{n})}{\text{n}}$
$\Rightarrow\overline{\text{x}}_\text{New}=\frac{\displaystyle\sum_{\text{i}=1}^{\text{n}}\text{x}_{\text{i}}}{\text{n}}+5=\overline{\text{x }}{\text{old}}+5$
$\Rightarrow\overline{\text{x}}_\text{New}=\overline{\text{x}}_\text{old}+5$
View full question & answer→MCQ 1261 Mark
The width of each of five continuous classes in a frequency distribution is $5$ and the lower-class limit of the lowest class is $10$. The upper-class limit of the highest class is:
AnswerThe classes are $10-15, 15-20, 20-25, 25-30, 30-35$ so that upper limit of the highest class is $35$.
View full question & answer→MCQ 1271 Mark
A data is such that its maximum value is $75$ and range is $20$, then the minimum value is:
AnswerDifference between the maximum and minimum value of the observations is called as range.
Let, minimum value be $'x'$
$75 - x = 20$
So, $x = 55$
View full question & answer→MCQ 1281 Mark
Write the correct answer in the following: The class marks of a frequency distribution are given as follows: $15, 20, 25, ....$ The class corresponding to the class mark $20$ is:
- A
$12.5 - 17.5$
- ✓
$17.5 - 22.5$
- C
$18.5 - 21.5$
- D
$19.5 - 20.5$
AnswerCorrect option: B. $17.5 - 22.5$
The class mark are $15, 20, 25, ….$
The size of each class interval is $25 - 20 = 20 - 15 = 5$
Hence, the class interval corresponding to the class mark $20$ is,
$(20 - 2.5) - (20 + 2.5)$ i.e., $17.5 - 22.5$.
So, $(b)$ is the correct answer.
View full question & answer→MCQ 1291 Mark
The graph given below shows the frequency distribution of the age of $22$ teachers in a school. The number of teachers whose age is less than $40$ years is:
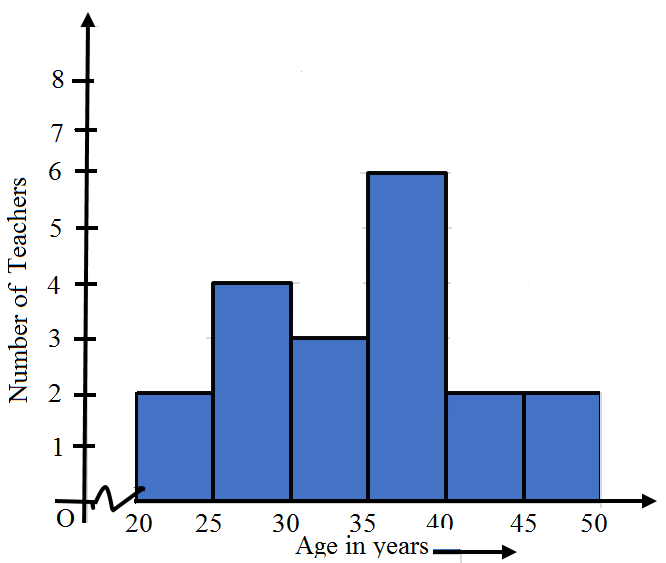
AnswerAdd the values corresponding to the height of the bar before $40$.
$6 + 3 + 4 + 2 = 15$.
View full question & answer→MCQ 1301 Mark
The mean of prime numbers between $30$ and $40$ is:
AnswerPrime numbers between $30$ and $40$ are $31$ and $37$.
Mean $=\frac{31+37}{2}$
Mean $=34$
View full question & answer→MCQ 1311 Mark
Find the median of the given data: $7, 8, 7, 7, 9, 10, 13$.
AnswerArrange the given data in ascending order.
$7, 7, 7, 8, 9, 10, 13$
For odd number $(n)$ of observation median $=\Big[\frac{(\text{n+1)}}{2}\Big]\text{th}$ term,
Here $n = 7$ so median $=\Big[\frac{{(7+1)}}{2}\Big]\text{th}$ term $= 4th$ term that is $8$,
Hence median $= 8$
View full question & answer→MCQ 1321 Mark
What is class size of interval $10, 12, 14, 16, 18$?
AnswerDifference between the successive values of the class is called the class size.
View full question & answer→MCQ 1331 Mark
- A
$3$(Mode – Mean)
- ✓
$3$(Mean – Median)
- C
$3$(Median – Mean)
- D
$3$(Mean – Mode)
AnswerCorrect option: B. $3$(Mean – Median)
Since, Mean – Mode + Mean + $2$ Mode = $3$ Median
$\Rightarrow $ Mean – Mode = $3$ Median – Mean – $2$ Mode
$= 3$ Median – Mean – $2 (3$ Median – $2$ Mean$)$
$= 3$ Median – Mean – $6$ Median + $4$ Mean
$= 3$ Mean – $3$ Median
$= 3$ (Mean – Median)
View full question & answer→MCQ 1341 Mark
To analyse the election results, the data is collected from a newspaper. The data thus collected is known as:
AnswerSecondary data is the readily available data collected by someone else & published in newspapers or journals etc.
View full question & answer→MCQ 1351 Mark
Median of the following numbers: $4, 4, 5, 7, 6, 7, 7, 12, 3$ is:
AnswerThe observations in ascending order can be written as:
$3, 4, 4, 5, 6, 7, 7, 7, 12$
Median $=\Big(\frac{9+1}{2}\Big)\text{th}$ term $= 5th$ term $= 6$
View full question & answer→MCQ 1361 Mark
The following marks were obtained by the students in a test: $81, 72, 90, 90, 86, 85, 92, 70, 71, 83, 89, 95, 85, 79, 62$ The range of the marks is.
AnswerRange of observations = Highest observation - Lowest observation
$= 95 - 62 = 33$
View full question & answer→MCQ 1371 Mark
Mode of the data $15, 14, 19, 20, 14, 15, 16, 14, 15, 18, 14, 19, 15, 17, 15$ is:
AnswerWe first arrange the given data in ascending order as follows $14, 14, 14, 14, 15, 15, 15, 15, 15, 16, 17, 18, 19, 19, 20$.
From above, we see that $15$ occurs most frequently i.e., $5$ times.
Hence, the mode of the given data is $15$.
View full question & answer→MCQ 1381 Mark
In a frequency distribution, the mid-value of a class is $10$ and width of each class is $6$. The lower limit of the class is:
AnswerGiven,
Mid value of the class $= 10$
Width of each class $= 6$
Now,
Let the lower limit be $x$.
We know,
Upper limit $=$ Lower limit $+$ class size
$= x + 6$
Also,
Mid value $=\frac{\text{x}+\text{x}+6}{2}$
$=\frac{2\text{x}+6}{2}=\text{x}+3$
$\Rightarrow\text{x}+3=10$
$\Rightarrow\text{x}=7$
Thus, the lower limit is $7$.
View full question & answer→MCQ 1391 Mark
If $x$ is the mean of $x_1, x_2, \ldots . . x_n, y$ is the mean of $y_1, y_2, \ldots x_n, \ldots y_n$, then $z$ the mean of $x_1, x_2, \ldots . x_n, y_1, y_2, \ldots . y$ is equal to:
- ✓
$\frac{\text{x}+\text{y}}{2}$
- B
$\frac{\text{x}+\text{y}}{\text{n}}$
- C
$\frac{\text{x}+\text{y}}{2\text{n}}$
- D
${\text{x+y}}$
AnswerCorrect option: A. $\frac{\text{x}+\text{y}}{2}$
Since $x^{-}$and $y^{-}$are two numbers, though being means, their arithmetic mean is given by:
$\text{z}=\frac{\text{x and y}}{2}$
View full question & answer→MCQ 1401 Mark
The median and mode of distribution are $20$ and $18$, then the mean is:
Answer$3$ Median $= 2 \times $ Mean + Mode
$\Rightarrow 3 \times 20 = 2 \times $ Mean + $18$
$\Rightarrow 2 \times$ Mean $= 60 - 18 = 42$
$\Rightarrow $ Mean $= 21$
View full question & answer→MCQ 1411 Mark
More than’ cumulative frequency table for a given data is as follows: Then, the frequency of the class interval $70-80$ is:
|
Marks
|
More than $89$
|
More than $79$
|
More than $69$
|
More than $59$
|
|
Cumulative frequency
|
$8$
|
$18$
|
$30$
|
$65$
|
AnswerA cumulative frequency distribution is the sum of the class and all classes below it in a frequency distribution.
Subtract cumulative frequency of class more than $70$ from the next cummulative Frequency of class more than $69$.
$30 − 18 = 12$
View full question & answer→MCQ 1421 Mark
In a bar graph if $1\ cm$ represents $30\ km$, then the length of bar needed to represent $75\ km$ is:
- A
$3.5\ cm$
- ✓
$2.5\ cm$
- C
$2\ cm$
- D
$3\ cm$
AnswerCorrect option: B. $2.5\ cm$
$1\ cm - 30\ km$
So for $75\ km$
$\frac{75}{30}=2.5\text{cm}$
View full question & answer→MCQ 1431 Mark
Write the correct answer in the following:
Median of the following numbers, $4, 4, 5, 7, 6, 7, 7, 12, 3$ is:
AnswerFirst, we arrange the given numbers in ascending order is,
$3, 4, 4, 5, 6, 7, 7, 7$ and $12$
Here, $n = 9$
Since, $n$ is odd, so we use the formula for median,
Now, Median $=\Big(\frac{\text{n}+1}{2}\Big)^{\text{th}}\text{observation}$
$=\Big(\frac{9+1}{2}\Big)^{\text{th}}\text{observation}$ [Put $n = 9$]
$=\Big(\frac{10}{2}\Big)^{\text{th}}\text{observation}$
$=5^{\text{th}}\text{observation}=6$
View full question & answer→MCQ 1441 Mark
The marks obtained by $17$ students in a mathematics test (out of $100$) are given below: $91, 82, 100, 100, 96, 65, 82, 76, 79, 90, 46, 64, 72, 68, 66, 48, 49$. Find the range of the data.
AnswerHighest Marks $= 100$
Lowest Marks $= 46$
Range of data $= 100 - 46 = 54$
View full question & answer→MCQ 1451 Mark
If each observation of the data is decreased by $8$ then their mean:
AnswerCorrect option: C. Is decreased by $8.$
Let the numbers be $x_1, x_2 \ldots ., x_n$
Now the new numbers after decrasing every number by $8:\left(x_1-8\right),\left(x_2-8\right) \ldots\left(x_n-8\right)$
New mean $=\frac{(\text{x}_1 - 8)+(\text{x}_2 - 8)+...+(\text{x}_\text{n} - 8)}{\text{n}}$
$=\frac{\text{x}_1+\text{x}_2+...+\text{x}_\text{n}-\text{8n}}{\text{n}}$
$=\frac{\text{x}_1+\text{x}_2+...+\text{x}_\text{n}}{\text{n}}-8$
New mean $=$ mean $-8$
Hence, mean is decreased by $8.$
View full question & answer→MCQ 1461 Mark
Tallys are usually marked in a bunch of:
AnswerTallies are usually marked in a bunch of $4$.
Hence, the correct option is $(b)$.
View full question & answer→MCQ 1471 Mark
Which one of the following is not a measure of central value?
AnswerThe difference between the highest value and the lowest value in the data set is called Range.
View full question & answer→MCQ 1481 Mark
In a frequency distribution, the mid-value of a class is $15$ and the class intervals is $4$. The lower limit of the class is:
AnswerLet $l$ and $m$ respectively be the lower and upper limits of the class.
Then the mid-value of the class is $\frac{\text{l+m}}{2}$ and the class-size is $(m - l)$.
Therefore, we have two equations
$\frac{\text{l+m}}{2}=15$
$\Rightarrow l + m = 30,$
$m - l = 4$
Subtracting the second equation from the first equation, we have
$(l + m) - (m - l) = 30 - 4$
$\Rightarrow l + m - m + l = 26$
$\Rightarrow 2l = 26$
$\Rightarrow l = 13$
Hence, the lower limit of the class is $13$. Thus, the correct choice is $(c)$.
View full question & answer→MCQ 1491 Mark
In a frequency distribution, the mid-value of a class is $60.5$ and the width of the class is $10$. The lower limit of the class is:
- A
$65.5$
- B
$62.5$
- C
$56.5$
- ✓
$55.5$
AnswerCorrect option: D. $55.5$
upper limit - lower limit = class width
upper limit - lower limit $= 10$
$\frac{\text{(upper limit + lower limit)}}{2}=\text{mid}-\text{value}$
upper limit + lower limit $= 2 \times 60.5$
upper limit + lower limit $= 121$
By solving the above two equations, we get
upper limit $= 65.5$
Lower limit $= 55.5$
View full question & answer→MCQ 1501 Mark
The range of the data $12, 25, 15, 18, 17, 20, 22, 6, 16, 11, 8, 19, 10, 30, 20, 32$ is:
AnswerWe have:
Maximum value $= 32$
Minimum value $= 6$
We know:
Range = Maximum value - minimum value
$= 32 - 6$
$= 26$
View full question & answer→MCQ 1511 Mark
The median of the numbers $4, 4, 5, 7, 6, 7, 7, 12, 3$ is:
AnswerArranging the points in an ascending order,
We have:
$3, 4, 4, 5, 6, 7, 7, 7, 12$
Here, $n = 9$, Which is odd
$\therefore\ $median score = value of $\frac{1}{2}(9+1)^\text{th}$ terms
= value of $\Big(\frac{1}{2}\times10\Big)^\text{th}$ term
= value of 5$^{th}$ term
= $6$
View full question & answer→MCQ 1521 Mark
The class marks of a frequency distribution are given as follows $15, 20, 25$ the class corresponding to the class mark $20$ is:
- A
$18.5 - 21.5$
- B
$19.5 - 20.5$
- C
$12.5 - 17.5$
- ✓
$17.5 - 22.5$
AnswerCorrect option: D. $17.5 - 22.5$
Clearly, lower limit of the class corrseponding to class mark $20$
$=\frac{\text{Class mark of precending class + 20}}{2}$
$=\frac{15+20}{2}=17.5$
Uppar limit of the class corresponding to the class mark $20$
$=\frac{\text{20 + Class mark of succeending class}}{2}$
$=\frac{20+25}{2}=\frac{45}{2}=22.5$
Hence the required class is $17.5 - 22.5$.
View full question & answer→MCQ 1531 Mark
If $x$ is the mean of $x_1, x_2, \ldots, x_n$ then for $\text{a}\neq0,$ the mean of $\text{ax}_1,\ \text{ax}_2,\ ...,\ \text{ax}_\text{n},\ \frac{\text{x}_1}{\text{a}},\ \frac{\text{x}_2}{\text{a}},\ ...,\ \frac{\text{x}_\text{n}}{\text{a}}$ is:
- A
$\frac{\Big(\text{a}+\frac{1}{\text{a}}\Big)\bar{\text{x}}}{2\text{n}}$
- ✓
$\Big(\text{a}+\frac{1}{\text{a}}\Big)\frac{\bar{\text{x}}}{2}$
- C
$\Big(\text{a}+\frac{1}{\text{a}}\Big)\frac{\bar{\text{x}}}{\text{n}}$
- D
$\Big(\text{a}+\frac{1}{\text{a}}\Big)\bar{\text{x}}$
AnswerCorrect option: B. $\Big(\text{a}+\frac{1}{\text{a}}\Big)\frac{\bar{\text{x}}}{2}$
Mean of $a x_1, a x_2, \ldots, a x_n$, is $\text{a}\bar{\text{x}}$
Mean of $\frac{\text{x}_1}{\text{a}},\ \frac{\text{x}_2}{\text{a}},\ ...,\ \frac{\text{x}_\text{n}}{\text{a}}$ is $\frac{1}{\text{a}}\bar{\text{x}}$
so the their mean is $\Big(\text{a}+\frac{1}{\text{a}}\Big)\frac{\bar{\text{x}}}{2}.$
View full question & answer→MCQ 1541 Mark
In the class intervals $10-20, 20-30,$ the number $20$ is included in:
AnswerCorrect option: B. $20-30$
This is the continuous from of frequency distribution.
Here, the upper limit of each class is excluded, while the lower limit is included.
So, the number $20$ is included in the class interval $20-30$.
View full question & answer→MCQ 1551 Mark
A grouped frequency table with class intervals of equal sizes using $250-270$ ($270$ not included in this interval) as one of the class interval is constructed for the following data : $268, 220, 368, 258, 242, 310, 272, 342, 310, 290, 300, 320, 319, 304, 402, 318, 406, 292, 354, 278, 210, 240, 330, 316, 406, 215, 258, 236$. The frequency of the class $310-330$ is:
AnswerThe class interval is $250 - 270, 270$ not included.
It means that the class is continuous.
Also, the data can be tabulated as follows:
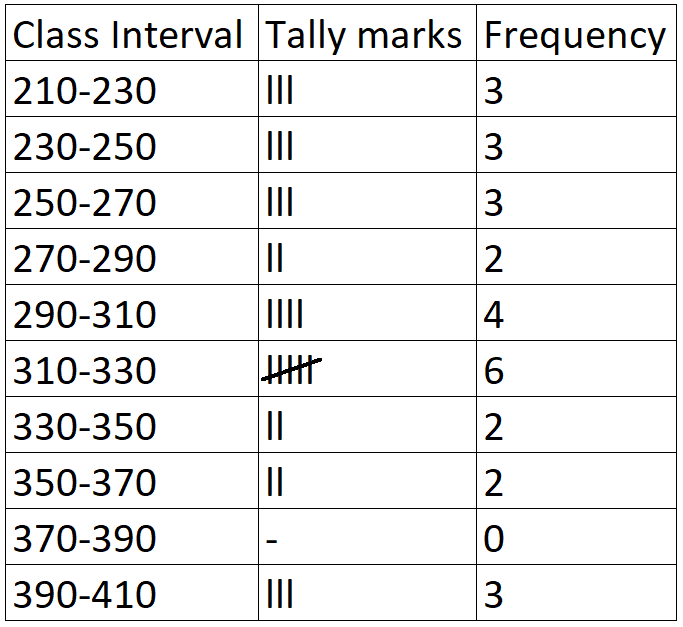
Thus, frequency of the class $310 - 330$ is $6$ as can be seen from the table. View full question & answer→MCQ 1561 Mark
$A, B, C$ are three sets of values of $x$:
$A: 2, 3, 7, 1, 3, 2, 3$
$B: 7, 5, 9, 12, 5, 3, 8$
$C: 4, 4, 11, 7, 2, 3, 4$
Which one of the following statements is correct? - A
Mean of $A$ = Mode of $C$
- B
Mean of $C$ = Median of $B$
- C
Median of $B$ = Mode of $A$
- ✓
Mean, Median and Mode of $A$ are equal.
AnswerCorrect option: D. Mean, Median and Mode of $A$ are equal.
$A: 1, 2, 2, 3, 3, 3, 7$
$B: 3, 5, 5, 7, 8, 9, 12$
$C: 2, 3, 4, 4, 4, 7, 11$
$\text{Mean of A}=\frac{1+2+2+3+3+3+7}{7}$
$=\frac{21}{7}=3$
$\text{Mean of B}=\frac{3+5+5+7+8+9+12}{7}$
$=\frac{49}{7}=7$
$\text{Mean of C}=\frac{2+3+4+4+4+7+11}{7}$
$=\frac{35}{7}=5$
Mode of $A = 3$; Median of $A = 3$
Mode of $B = 5$; Median of $B = 7$
Mode of $C = 4$; Median of $C = 4$
(Mean of $A = 3$) $\neq$ (Mode of $C = 4$)
(Mean of $C = 5$) $\neq$ (Median of $B = 4$)
(Median of $B = 7$) $\neq$ (Mode of $A = 3$)
Mean of $A = 3$, Mode of $A = 3$, Median of $A = 3$ View full question & answer→MCQ 1571 Mark
A set of data consists of six numbers: $7, 8, 8, 9, 9$ and $x$. The difference between the modes when $x = 9$ and $x = 8$ is:
AnswerThe mode in a list of numbers refers to the integers that occurs most number of times.
In the given list both $8$ and $9$ occur two times.
So the value of will decide the mode
If $x = 8$, then mode will be $8$
If $x = 9$, then mode will be $9$
Hence, differnce between two modes is $1$.
View full question & answer→MCQ 1581 Mark
The mean of $n$ observations is $x$ If the first item is increased by $1$, second by $2$, third by $3$ and so on, then the new mean is:
- ✓
$\text{x}+\frac{\text{n}+1}{2}$
- B
$\text{x}+\frac{\text{n}}{2}$
- C
$\text{x}+\frac{\text{n}(\text{n}+1)}{2}$
- D
$\text{x}+\text{n}$
AnswerCorrect option: A. $\text{x}+\frac{\text{n}+1}{2}$
If the first item is increased by $1$, second by $2$, third by $3$ and so on,
So the new sequence thus formed is $x_1+1, x_2+2, x_3+3 \ldots \ldots x_n+n$
So the new mean is increased by $\frac{\text{n}+1}{2}$
So the new mean is $\text{x}+\frac{\text{n}+1}{2}$
Where $x$ is the mean of first $n$ numbers.
View full question & answer→MCQ 1591 Mark
The given data is $3, 5, 6, 7, 5, 4, 7, 5, 6, x, 8$ and $7$. Then the value of $x$ for which the mode of the above data will be $7$, is:
AnswerThe mode in a list of numbers refers to the integers that occur most number of times.
In the given list $5$ occur three times and $7$ occurs three times.
For $7$ to be mode of the list it should occur more number of times than any other number
So $x$ should be $7$.
Mode $= 7$
View full question & answer→MCQ 1601 Mark
Write the correct answer in the following: There are $50$ numbers. Each number is subtracted from $53$ and the mean of the numbers so obtained is found to be $-3.5$. The mean of the given numbers is:
- A
$46.5$
- B
$49.5$
- C
$53.5$
- ✓
$56.5$
AnswerCorrect option: D. $56.5$
Given, $n = 50$, then mean $\bar{\text{x}}=\frac{\sum\limits^{\text{n}}_{\text{i}=1}\text{x}_\text{i}}{\text{n}}$
Then, $\bar{\text{x}}=\frac{1}{50}\times\sum\limits^{50}_{\text{i}=1}\text{x}_\text{i}$
$\Rightarrow\sum\limits^{50}_{\text{i}=1}\text{x}_\text{i}=50\bar{\text{x}}$
Now, subtract each observation from $53$, we get a new mean say $\bar{\text{x}}_\text{new}$
$\therefore\ \bar{\text{x}}_\text{new}=\frac{(-\text{x}_1+53)+(-\text{x}_2+53)\ +\ .....\ +(-\text{x}_{50}+53)}{50}$
$\Rightarrow-3.5=\frac{-(\text{x}_1+\text{x}_2\ +\ .....\ +\text{x}_{50})+(53+53\ +\ ....\ +50\text{times})}{50}$
$\Rightarrow-3.5\times50=(-\text{x}_1+\text{x}_2+\ ....\ +\text{x}_{50})+53\times50$
$\therefore$ Mean of $50$ observation $=\frac{1}{50}\sum\limits^{50}_{\text{i}=1}\text{x}_{\text{i}}$
$=\frac{1}{50}\times2852=56.5$ $\Bigg[\because\text{ mean}=\frac{\sum\limits^{\text{n}}_{\text{i}=1}\text{x}_\text{i}}{\text{n}}\Bigg]$
Hence, the mean of given number is $56.5$.
View full question & answer→MCQ 1611 Mark
If the mean of $x, x + 3, x + 5, x + 7, x + 10$ is $9$, the mean of the last three observation is:
- A
$10\frac{1}{3}$
- B
$10\frac{2}{3}$
- ✓
$11\frac{1}{3}$
- D
$11\frac{2}{3}$
AnswerCorrect option: C. $11\frac{1}{3}$
Mean of $5$ observations $= 9$
$\text{Mean}=\frac{\text{Sum of all observations}}{\text{Total number of observation}}$
$\Rightarrow9=\frac{\text{x}+\text{x}+3+\text{x}+5+\text{x}+7+\text{x}+10}{5}$
$\Rightarrow9=\frac{5\text{x}+18}{5}$
$\Rightarrow45=5\text{x}+18$
$\Rightarrow5\text{x}=20$
$\Rightarrow\text{x}=4$
So, the mean of the last three observations
$=\frac{\text{x}+5+\text{x}+7+\text{x}+10}{3}$
$=\frac{4+5+4+7+4+10}{3}$
$=\frac{34}{3}$
$=11\frac{1}{3}$
View full question & answer→MCQ 1621 Mark
Write the correct answer in the following: Let m be the mid-point and $l$ be the upper class limit of a class in a continuous frequency distribution. The lower class limit of the class is:
- A
$2m + l$
- ✓
$2m - l$
- C
$m - l$
- D
$m - 2l$
AnswerCorrect option: B. $2m - l$
Let $x$ and $y$ be the lower and upper class limit of a continuous frequency distribution.
Now, mid-point of a class $=\frac{(\text{x}+\text{y})}{2}=\text{m}$ [given]
$\Rightarrow x + y = 2m = x + l = 2m$
$\big[\therefore$ $y = l =$ upper class limit (given)$\big]$
$\Rightarrow x = 2m - l$
Hence, the lower class limit of the class is $2m - l$.
View full question & answer→MCQ 1631 Mark
The width of each of nine classes in a frequency distribution is $2.5$ and the lower class boundary of the lowest class $10.6$. Then the upper class boundary of the highest class is:
- A
$28.1$
- ✓
$33.1$
- C
$35.6$
- D
$30.6$
AnswerCorrect option: B. $33.1$
Number of classes $= 9$
Lower limit of the lowest class $= 10.6$
Width of each class $= 2.5$
So, Upper limit of the lowest class $= 10.6 + 2.5 = 13.1$
Now, Upper limit of the lowest class + Width of each class = Upper limit of the next class
Thus, we have
Upper limit of the lowest class + $8 \times $ width of each class = Upper limit of the highest ($9$$^{th}$) class
Upper limit of the highest (9$^{th}$) class $= 13.1 + 8 \times 2.5 = 33.1$
View full question & answer→MCQ 1641 Mark
Let $\bar{x}$ be the mean of $x_1, x_2, \ldots, x_n$ and $\bar{y}$ be the mean of $y_1, y_2, \ldots, y_n$. If $\bar{z}$ is the mean of $x_1, x_2, \ldots, x_n, y_1, y_2, \ldots, y_n$ then $\overline{ z }=?$
- A
$(\bar{\text{x}}+\bar{\text{y}})$
- ✓
$\frac{1}{2}(\bar{\text{x}}+\bar{\text{y}})$
- C
$\frac{1}{\text{n}}(\bar{\text{x}}+\bar{\text{y}})$
- D
$\frac{1}{2\text{n}}(\bar{\text{x}}+\bar{\text{y}})$
AnswerCorrect option: B. $\frac{1}{2}(\bar{\text{x}}+\bar{\text{y}})$
Since $\bar{z}$ is the mean of $x_1, x_2, \ldots, x_n, y_1, y_2, \ldots, y_n$
$\overline{ z }=\frac{\left( x _1+ x _2+\ldots+ x _{ n }\right)+\left( y _1+ y _2+\ldots y _{ n }\right)}{2 n }$
Since $\overline{ x }$ is the mean of $x _1, x _2, \ldots, x _{ n }$,
$\overline{ x }=\frac{ x _1+ x _2+\ldots+ x _{ n }}{ n }$
$\Rightarrow x _1+ x _2+\ldots+ x _{ n }= n \overline{ x }$
Since $\bar{y}$ is the mean of $y_1, y_2, \ldots, y_n$,
$\overline{ y }=\frac{ y _1+ y _2+\ldots+ y _{ n }}{ n }$
$\Rightarrow y _1+ y _2+\ldots+ y _{ n }= n \overline{ y }$
so,
$\overline{ z }=\frac{ n \overline{ x }}{2 n }+\frac{ n \overline{ y }}{2 n }=\frac{ n \overline{ x }+ n \overline{ y }}{2 n }$
$=\frac{\overline{ x }+\overline{ y }}{2}$
View full question & answer→MCQ 1651 Mark
Write the correct answer in the following: If each observation of the data is increased by $5$, then their mean:
AnswerCorrect option: D. Is increased by $5$.
Let $x_1, x_2, \ldots, x_n$ be the $n$ observation,
Then, old mean $\bar{\text{x}}_{\text{old}}=\frac{\sum\limits_{\text{i}=1}^\text{n}\text{x}_\text{i}}{\text{n}}\ \dots(\text{i})$
Now, adding $5$ in each obsevation, the new mean becomes
$\bar{\text{x}}_{\text{new}}=\frac{(\text{x}_1+5)+(\text{x}_2+5)+\ ...\ +(\text{x}_\text{n}+5)}{\text{n}}$
$\Rightarrow\ \bar{\text{x}}_{\text{new}}=\frac{(\text{x}_1+\text{x}_2+\ ...\ +\text{x}_\text{n})+5\text{n}}{}$
$\Rightarrow\ \bar{\text{x}}_{\text{new}}=\frac{\sum\limits_{\text{i}=1}^\text{n}\text{x}_\text{i}}{\text{n}}+5=\bar{\text{x}}_{\text{old}}+5$ [from Eq. $(i)$]
$\Rightarrow\ \bar{\text{x}}_\text{new}=\bar{\text{x}}_{\text{old}}+5$
Hence, the new mean is increased by $5$.
View full question & answer→MCQ 1661 Mark
To draw a histogram to represent the following frequency distribution:
|
Class interval
|
$5-10$
|
$10-15$
|
$15-25$
|
$25-45$
|
$45-75$
|
|
Frequency
|
$6$
|
$12$
|
$10$
|
$8$
|
$15$
|
The adjusted frequency for the class $25-45$ is: AnswerAdjusted Frequency $=\Big(\frac{\text{Frequncey of the class }}{\text{widthof the class}}\Big)\times5$
Therefore adjusted frequencey of $25-45=\frac{8}{20}\times5=2$
View full question & answer→MCQ 1671 Mark
Tally marks are used to find:
AnswerTally marks are used to find the frequencies.
Hence, the correct choice is $(c)$.
View full question & answer→MCQ 1681 Mark
In a bar graph, the widths of bars:
- A
Are proportional to the corresponding heights.
- B
Are proportional to the corresponding frequencies.
- C
Are proportional to the space between two consecutive bars.
- ✓
AnswerBar graph is a pictorial representation of data variables($x$-axis versus it value on $y$-axis) height of the bar.
Hence width of bar has no significance in bar graph.
View full question & answer→MCQ 1691 Mark
The mean for counting numbers through $100$ is:
- A
$51$
- B
$55.5$
- ✓
$50.5$
- D
$49.5$
AnswerCorrect option: C. $50.5$
Mean of n natural numbers is $\frac{(\text{n+1})}{2}$ So
Mean of $100$ numbers $=\frac{100+1}{2}$
Mean of $100$ numbers $=\frac{100}{2}=50.5$
View full question & answer→MCQ 1701 Mark
The abscissa of the point of intersection of the less than type and of the more than type ogives of a grouped data gives its:
AnswerThe abscissa of the point of intersection of the less than type and of the more than type ogives of a grouped data gives its Median. Since the point of intersection of the more than type ogive and less than type ogive gives the median on the $x$-axis.
View full question & answer→MCQ 1711 Mark
Out of sixteen observations arranged in an ascending order, the $8$$^{th}$ and $9$$^{th}$ observations are $25$ and $27$. Then, the median is:
AnswerThe median is the middle score for a set of data that has been arranged in ascending or descending order of magnitude.
If the number of observation is even (as in this example), then the median is the average of two middle numbers
Hence, the average of $25$ and $27$ is $\frac{25+27}{2}=26$
So the median is $26$.
View full question & answer→MCQ 1721 Mark
The mean of n observations is $\overline{\text{X}}.$ If k is added to each observation, then the new mean is:
- A
$\overline{\text{X}}$
- ✓
$\overline{\text{X}}+\text{k}$
- C
$\overline{\text{X}}-\text{k}$
- D
$\text{k}\overline{\text{X}}$
AnswerCorrect option: B. $\overline{\text{X}}+\text{k}$
$\text{Mean}=\overline{\text{X}}=\frac{\text{Sum of all observations}}{\text{Total number of observations}}$
$=\frac{\text{Sum of all observations}}{\text{n}}$
Now if k is aded to each observation
$\text{New Mean},\overline{\text{X'}}=\frac{\text{Sum of all observations}+\text{nk}}{\text{n}}$
$=\frac{\text{Sum of all observations}}{\text{n}}+\text{k}$
$\Rightarrow\overline{\text{X}'}=\overline{\text{X}}+\text{k}$
View full question & answer→MCQ 1731 Mark
Class mark of a particular class is $9.5$ and the class size is $6$, then the class interval is:
- ✓
$6.5 - 12.5$
- B
$15.5 - 27.5$
- C
$3.5 - 15.5$
- D
$12.5 - 18.5$
AnswerCorrect option: A. $6.5 - 12.5$
Class mark $=\frac{\text{upper limit+lower limit}}{2}$
$2 \times 9.5$ = upper limit + lower limit
$19$ = upper limit + lower limit
Class size = upper limit - lower limit
$6$ = upper limit - lower limit
Solving above two equations we get,
$2 \times $ upper limit $= 25$
upper limit $= 12.5$
Hence, lower lower limit $= 12.5 - 6 = 6.5$
So, the class interval is$ 6.5 - 12.5$.
View full question & answer→MCQ 1741 Mark
In a histogram the class intervals or the groups are taken along:
AnswerCorrect option: A. $X$-axis.
Histogram states that a two dimensional frequency density diagram is called as a histogram. The histograms are diagrams which represent the class interval and the frequency in the form of a rectangle. There will be as many adjoining rectangles as there are class intervals.
View full question & answer→MCQ 1751 Mark
The difference between the mean and median of first five prime numbers is:
AnswerFirst five prime numbers are $2, 3, 5, 7, 11$
Mean is $\frac{2+3+5+7+11}{5}$
$\frac{28}{5}=5.6$
Median is $5$
So the difference between them is $5.6 - 5 = 0.6$
View full question & answer→MCQ 1761 Mark
The mean of five numbers is $30$. If one number is excluded, their mean becomes $28$. The excluded number is:
AnswerLet $a, b, c, d$ and $e$ are five numbers, then
Mean $=\frac{\text{(a + b + c + d + e)}}{5}=30$
$\Rightarrow (a + b + c + d + e) = 150 ..... (1)$
Now Let the number excluded be a
Then new mean $=\frac{\text{(b + c + d + e)}}{4}=28$
$\Rightarrow (b + c + d + e) = 112$
Putting this value in $(1)$
$\Rightarrow a + 112 = 150$
$\Rightarrow a = 150 - 112 = 38$
$\therefore$ Excluded number $= 38$
View full question & answer→MCQ 1771 Mark
Write the correct answer in the following: If the mean of the observations: $x, x + 3, x + 5, x + 7, x + 10$ is $9$, the mean of the last three observations is:
- A
$10\frac{1}{3}$
- B
$10\frac{2}{3}$
- ✓
$11\frac{1}{3}$
- D
$11\frac{2}{3}$
AnswerCorrect option: C. $11\frac{1}{3}$
Given that, the mean of the observation $x, x + 3, x + 5, x + 7$ and $x + 10$ is $9$.
$\therefore\ \frac{\text{x}+\text{x}+3+\text{x}+5+\text{x}+7+\text{x}+10}{5}=9$
$\Rightarrow {\text{5x}}+25=45$
$\Rightarrow\text{5x}=20$
$\Rightarrow \text{x}=4$
$\therefore$ Last three odservations are $x + 5 = 4 + 5 = 9, x + 7 = 4 + 7 = 11$
and $x + 10 = 4 + 10 = 14$
So, the mean of last three observations $=\frac{9+11+14}{3}=\frac{34}{3}=11\frac{1}{3}$
Hence, the mean of last three observation is $11\frac{1}{3}.$
View full question & answer→MCQ 1781 Mark
There are $50$ numbers. Each number is subtracted from $53$ and the difference between the mean of the numbers so obtained is found to be $3.5$. The mean of the given number is:
- ✓
$56.5$
- B
$52.5$
- C
$49.5$
- D
$47.5$
AnswerCorrect option: A. $56.5$
Let the mean of the initial sequence is $x$.
Given that, after subtracting $53$ from each number, the difference between the means is $3.5$.
So, $x - 53 = 3.5$
Mean of the number is $x = 53 + 3.5 = 56.5$
View full question & answer→MCQ 1791 Mark
Find out the mode of the following: $5, 4, 3, 5, 6, 6, 6, 5, 4, 5, 5, 3, 2, 1$.
AnswerThe observation which occurs maximum number of times is called the mode of the given data.
Above given data has a maximum number of $5$, so the mode is $5$.
View full question & answer→MCQ 1801 Mark
$A, B, C$ are three sets of values of $x;$
$A. 2, 3, 7, 1, 3, 2, 3$
$B. 7, 5, 9, 12, 5, 3, 8$
$C. 4, 4, 11, 7, 2, 3, 4$
Which one of the following statements is correct?
- A
Median of $B =$ Mode of $A$.
- B
Mean of $A =$ Mode of $C$.
- ✓
Mean, Median and Mode of $A$ are equal.
- D
Mean of $C =$ Median of $B$.
AnswerCorrect option: C. Mean, Median and Mode of $A$ are equal.
For the data $A: 2, 3, 7, 1, 3, 2, 3,$ of $7$ numbers, we have
Mean $=\frac{2+3+7+1+3+2+3}{7}=\frac{21}{7}=3$
Arranging the data $A$ in ascending orer we have
$A: 1, 2, 2, 3, 3, 3, 7$
Median $=\Big(\frac{7+1}{2}\Big)^\text{th}$ Value
$= 4^{th}$ value $= 3$
Since, $3$ occurs maximum number of times, Mode $= 3$
Mean $=$ Median $=$ Mode
View full question & answer→MCQ 1811 Mark
In a frequency distribution, the mid-value of a class is $15$ and the class intervals is $4$. The lower limit of the class is:
AnswerLet the lower limit be $x$.
Class interval $= 4$
Upper limit $= x + 4$
Now, mid - value of a class $=\frac{\text{x}+4+\text{x}}{2}=\text{x}+2=15(\text{given)}$
$x = 13 =$ lower limit
View full question & answer→MCQ 1821 Mark
N a histogram the area of each rectangle is proportional to:
- A
The class size of the corresponding class interval.
- B
Cumulative frequency of the corresponding class interval.
- ✓
Frequency of the corresponding class interval.
- D
The class mark of the corresponding class interval.
AnswerCorrect option: C. Frequency of the corresponding class interval.
A histogram is a display of statistical information that uses rectangles to show the frequency of data items in successive numerical intervals of equal size. In the most common form of histogram, the independent variable is plotted along the horizontal ax is and the dependent variable is plotted along the vertical ax is.
View full question & answer→MCQ 1831 Mark
In the class intervals $10-20, 20-30, 20$ is taken in:
AnswerCorrect option: B. The interval $20-30$.
The given class intervals are $10-20, 20-30$. In these class intervals the value $20$ is lies in the class interval $20-30$.Hence, the correct choice is $(b)$.
View full question & answer→MCQ 1841 Mark
Write the correct answer in the following: Mode of the data $15, 14, 19, 20, 14, 15, 16, 14, 15, 18, 14, 19, 15, 17, 15$ is:
AnswerWe first arrange the given data in ascending order as follows $14, 14, 14, 14, 15, 15, 15, 15, 15, 16, 17, 18, 19, 19, 20$ From above, we see that $15$ occurs most frequently i.e., $5$ times.
View full question & answer→MCQ 1851 Mark
Let $L$ be the lower class boundary of a class in a frequency distribution and m be the midpoint of the class. Which one of the following is the upper class boundary of the class?
AnswerCorrect option: D. $2\text{m}-\text{L}$
Mid - value $=\frac{\text{Lower limit + Upper limit}}{2}$
$\Rightarrow\text{m}=\frac{\text{L+U}}{2}$
$\Rightarrow U = 2m - L$
$\therefore$ Upper class boundary of the class $= 2m – L$
View full question & answer→MCQ 1861 Mark
The mean of a set of seven numbers is $81$. If one of the numbers is discarded, the mean of the remaining numbers is $78$. The value of discarded number is:
Answer$\text{Mean}=81=\frac{\text{Sum of seven numbers}}{7}$
$\Rightarrow $ Sum of seven numbers $= 81 \times 7 = 567$.
Let the discared number be $x$.
$\Rightarrow $ Sum of $6$ numbers $= 567 - x$
Now, mean of remaining $6$ numbers $=\frac{567-\text{x}}{6}=78$
$\Rightarrow 567 - x = 468$
$\Rightarrow x = 99$
So, discarded number is $99$.
View full question & answer→MCQ 1871 Mark
A histogram is a pictorial representation of the grouped data in which class intervals and frequency are respectively taken along:
- A
- B
Vertical axis and horizontal axis.
- ✓
Horizontal axis and vertical axis.
- D
AnswerCorrect option: C. Horizontal axis and vertical axis.
Correct option is $(c)$.
A histogram is a pictorial representation of the grouped data in which class interval and frequency are respectively taken along horizontal axis and vertical axis.
View full question & answer→MCQ 1881 Mark
The marks obtained by $10$ students in a mathematics test are $75, 90, 70, 50, 70, 50, 75, 90, 70$ and $75$. Their median mark is:
AnswerCorrect option: B. $72.5$
The median is the middle value for a set of data that has been arranged in ascending or descending order of magnitude.
Arrange the given observations in ascending order $50, 50, 70, 70, 70, 75, 75, 75, 90, 90$
Here two numbers $70$ and $75$ are in the middle.
So, median is average of $70$ and $75$
$=\frac{70+75}{2}=72.5\text{ i..e }72.5$
View full question & answer→MCQ 1891 Mark
If the mean of five observations $x, x + 2, x + 4, x + 6$ and$ x + 8$ is $11$ then the value of $x$ is:
AnswerMean of $5$ observations $= 11$
We know:
Mean $=\frac{\text{Sum of all observations}}{\text{Total number of observations}}$
$\Rightarrow 11=\frac{\text{x}+\text{x}+2+\text{x}+4+\text{x}+6+\text{x}+8}{5}$
$\Rightarrow11=\frac{\text{5x+20}}{5}$
$\Rightarrow 5x + 20 = 55$
$\Rightarrow 5x = 35$
$\Rightarrow x = 7$
View full question & answer→MCQ 1901 Mark
In the 'less than' type of ogive the cumulative frequency is plotted against:
- A
The lower limit of the concerned class interval.
- B
The mid-value of the concerned class interval.
- ✓
The upper limit of the concerned class interval.
- D
Any value of the concerned class interval.
AnswerCorrect option: C. The upper limit of the concerned class interval.
In a less than o-give we plot the points with the upper limits of the class as abscissa and the corresponding less than cumulative frequency as ordinates. It is a rising curve.
View full question & answer→MCQ 1911 Mark
The mean of $100$ observations is $50$. If one of the observations which was $50$ is replaced by $150$, the resulting mean will be:
AnswerMean of $100$ observation $= 50$
$\therefore$ Total of $100$ observation $= 100 \times 50 = 5000$.
If one of the observation $50$ is replaced by $150$ than total of new observation is $= 5000 - 50 + 150 = 5100$
Hence the mean of new $100$ observation $=\frac{5100}{100}=51$
View full question & answer→MCQ 1921 Mark
If $x$ is mean of $x_1, x_2, \ldots .$. then for $a \neq 0$, the mean of $a x_1, a x_2, \ldots . a x_n, \frac{x_1}{a}, \frac{x_2}{a}, \ldots \frac{x_n}{a}$, is:
- A
$\Big(\text{a}+\frac{1}{\text{a}}\Big)\text{x}$
- B
$\frac{\Big(\text{a}+\frac{1}{\text{a}}\Big)}{2\text{n}}$
- ✓
$\Big(\text{a}+\frac{1}{\text{a}}\Big)\frac{\text{x}}{2}$
- D
$\Big(\text{a}+\frac{1}{\text{a}}\Big)\frac{\text{x}}{\text{n}}$
AnswerCorrect option: C. $\Big(\text{a}+\frac{1}{\text{a}}\Big)\frac{\text{x}}{2}$
Mean of $a x_1, a x_2, \ldots . a x_n$, is $a x$
Mean of $\frac{\text{x}_1}{\text{a}},\frac{\text{x}_2}{\text{a}},...\frac{\text{x}_n}{\text{a}},$is $\frac{1}{\text{a}}\text{x}$
So the their mean is $\Big(\text{a}+\frac{1}{\text{a}}\Big)\frac{\text{x}}{2}$
View full question & answer→MCQ 1931 Mark
The mid-value of a class interval is $42$. If the class size is $10$, then the upper and lower limits of the class are:
- A
$37$ and $47$
- ✓
$47$ and $37$
- C
$47.5$ and $37.5$
- D
$37.5$ and $47.5$
AnswerCorrect option: B. $47$ and $37$
Let the lower limit of a class $= x$
Class size $= 10$
Upper limit $= x + 10$
Now mid - value $=\frac{\text{x}+10+\text{x}}{2}=\text{x}+5=42(\text{given})$
$x = 37 =$ lower limit
$x + 10 = 47 =$ upper limit
Thus, upper and lower limits are $47, 37$.
View full question & answer→MCQ 1941 Mark
Write the correct answer in the following: The class mark of the class $90-120$ is:
Answer$\text{Class mark }=\frac{\text{Upperlimit + Lowerlimit}}{2}$
$\Rightarrow \text{Class mark}=\frac{90+120}{2}=\frac{210}{2}=105$
View full question & answer→MCQ 1951 Mark
If $\overline{ x }_1, \overline{ x }_2, \ldots, \overline{ x }_{ n }$ are the means of n group with $n _1, n _2, \ldots, n _{ n }$ number of observation respectively then the mean $\overline{ x }$ of all the groups taken together is:
- A
$\sum\limits_{\text{i}=1}^\text{n}\text{n}_\text{i}\bar{\text{x}}_\text{i}$
- B
$\frac{\sum\limits_{\text{i}=1}^\text{n}\text{n}_\text{i}\bar{\text{x}}_\text{i}}{\text{n}^2}$
- ✓
$\frac{\sum\limits_{\text{i}=1}^\text{n}\text{n}_\text{i}\bar{\text{x}}_\text{i}}{\sum\limits_{\text{i}=1}^\text{n}\text{n}_\text{i}}$
- D
$\frac{\sum\limits_{\text{i}=1}^\text{n}\text{n}_\text{i}\bar{\text{x}}_\text{i}}{2\text{n}}$
AnswerCorrect option: C. $\frac{\sum\limits_{\text{i}=1}^\text{n}\text{n}_\text{i}\bar{\text{x}}_\text{i}}{\sum\limits_{\text{i}=1}^\text{n}\text{n}_\text{i}}$
Sum of the terms $=\text{n}_1\bar{\text{x}_1}+\text{n}_2\bar{\text{x}}_2+\ _{\dots},+\text{n}_\text{n}\bar{\text{x}}_\text{n}$
Number of terms $=\text{n}_1+\text{n}_2+\ _{\dots}+\text{n}_\text{n}$
Required mean $=\frac{\sum\limits_{\text{i}=1}^\text{n}\text{n}_\text{i}\bar{\text{x}}_\text{i}}{\sum\limits_{\text{i}=1}^\text{n}\text{n}_\text{i}}$
View full question & answer→MCQ 1961 Mark
The median of the numbers $84, 78, 54, 56, 68, 22, 34, 45, 39, 54$ is:
AnswerArranging the points in an ascending order,
We have:
$22, 34, 39, 45, 54, 56, 68, 78, 84$
Here, $n = 10$, Which is even
$\therefore\ $median = mean of $\Big(\frac{10}{2}\Big)^\text{th}$ and $\Big(\frac{10}{2}+1\Big)^\text{th}$ terms
$=$ mean of $\Big(\frac{10}{2}\Big)^\text{th}$ and $\Big(\frac{12}{2}\Big)^\text{th}$ term
$=$ mean of $5^{th}$ and $6^{th}$ terms
$=\frac{1}{2}(54+54)$
$\frac{1}{2}\times108$
$=54$
View full question & answer→MCQ 1971 Mark
In the given graph, the number of students who scored $60$ or more marks is:

AnswerAdd the values corresponding to the height of the bar from $60$ to $100$
$10 + 5 + 3 + 3 = 21$
View full question & answer→MCQ 1981 Mark
Mode of a set of observations is the value which:
- A
Divides the observations into two equal parts.
- ✓
- C
Is the mean of the middle two observations.
- D
Is the sum of the observations.
AnswerIn statistics, the mode in a list of numbers refers to the integers that occurs most number of times.
View full question & answer→MCQ 1991 Mark
If $\bar{x}$ is the mean of $x_1, x_2, \ldots . ., x_n$, then for $a \neq 0$, then mean of $a x_1, a x_2, \ldots a x_n, \frac{x_1}{a}, \frac{x_2}{a}, \ldots, \frac{x_n}{a}$ is:
- A
$\Big(\text{a}+\frac{1}{\text{a}}\Big)\bar{\text{x}}$
- ✓
$\Big(\text{a}+\frac{1}{\text{a}}\Big)\frac{\bar{\text{x}}}{2}$
- C
$\Big(\text{a}+\frac{1}{\text{a}}\Big)\frac{\bar{\text{x}}}{\text{n}}$
- D
$\frac{\big(\text{a}+\frac{1}{\text{a}}\big)\bar{\text{x}}}{2\text{n}}$
AnswerCorrect option: B. $\Big(\text{a}+\frac{1}{\text{a}}\Big)\frac{\bar{\text{x}}}{2}$
Given, mean of $x_1, x_2, \ldots . ., x_n$ is $\bar{\text{x}}$
$\therefore\ \sum\limits^\text{n}_{\text{i}=1}\text{x}_\text{i}=\text{n}\bar{\text{x}}$
Now, let the mean of $\Big(\text{ax}_1,\text{ax}_2,\ ....\text{ ax}_\text{n},\frac{\text{x}_1}{\text{a}},\frac{\text{x}_2}{\text{a}},\ ...., \ \frac{\text{x}_\text{n}}{\text{a}}\Big)$ is $\bar{\text{z}}$
Then, $\bar{\text{z}}=\frac{(\text{ax}_1,\text{ax}_2,\ ....\text{ ax}_\text{n})+\Big(\frac{\text{x}_1}{\text{a}},\frac{\text{x}_2}{\text{a}},\ ...., \ \frac{\text{x}_\text{n}}{\text{a}}\Big)}{\text{n}+\text{n}}$
$=\frac{\text{a}(\text{x}_1+\text{x}_2+\ ....\ +\text{x}_\text{n})+\frac{1}{\text{a}}(\text{x}_1+\text{x}_2+\ ....\ +\text{x}_\text{n})}{2\text{n}}$
$=\frac{\big(\text{a}+\frac{1}{\text{a}}\big)(\text{x}_1+\text{x}_2+\ ....\ +\text{x}_\text{n})}{2\text{n}}$
$=\frac{\big(\text{a}+\frac{1}{\text{a}}\big)\sum\limits^\text{n}_{\text{i}=1}\text{x}_\text{i}}{2\text{n}}$
$=\frac{\big(\text{a}+\frac{1}{\text{a}}\big)\cdot\text{n}\bar{\text{x}}}{2\text{n}}$
$=\frac{\big(\text{a}+\frac{1}{\text{a}}\big){\bar{\text{x}}}}{2}$
View full question & answer→MCQ 2001 Mark
The width of each of nine classes in a frequency distribution is $2.5$ and the lower class boundary of the lowest class 10.6. Then the upper class boundary of the highest class is:
- A
$35.6$
- ✓
$33.1$
- C
$30.6$
- D
$28.1$
AnswerCorrect option: B. $33.1$
The number of classes is $9$ and the uniform class size is $2.5$.
The lower limit of the lower class (first class) is $10.6$.
Therefore, the upper limit of the last class is
$10.6 + (9 × 2.5)$
$= 10.6 + 22.5$
$= 33.1$
Hence, the correct choice is $(b)$.
View full question & answer→MCQ 2011 Mark
The following observations have been arranged in ascending order: $18, 20, 25, 26, 30, x, 37, 38, 39, 48$.
If the median of the data is $35$, then the value of $x$ is:
AnswerThe median is the middle score for a set of data that has been arranged in ascending or descending order of magnitude.
For even number of observations, the median is calculated as an average of two middle numbers.
For the given example $30$ and $x$ are in the middle and the median is $35$.
So,
$35=\frac{30+\text{x}}{2}$
$70=30+\text{x}$
$\text{x}=40$
View full question & answer→MCQ 2021 Mark
For drawing a frequency polygon of a continuous frequency distribution, we plot the points whose ordinates are the frequency of respective classes and abscissa are respectively.
- ✓
Class marks of the classes.
- B
Upper limits of preceding classes.
- C
Lower limits of the classes.
- D
Upper limits of the classes.
AnswerCorrect option: A. Class marks of the classes.
Frequency polygon is the line graph plotted with class marks on $x$-axis & frequency of the class on $y$-axis.
View full question & answer→MCQ 2031 Mark
Vihaan has marks of $92, 85,$ and $78$ in three mathematics tests. In order to have an average of exactly $87$ for the four math tests, he should obtain:
- A
$90$ marks
- ✓
$93$ marks
- C
$92$ marks
- D
$91$ marks
AnswerCorrect option: B. $93$ marks
Let, Vihaan obtains $x$ marks in the fourth test.
So,
$\frac{92+85+78+\text{x}}{4}=87$
$\frac{255+\text{x}}{4}=87$
$255 + x = 348$
$x = 348 - 255$
$x = 93$ marks
View full question & answer→MCQ 2041 Mark
The median of the following data: $0, 2, 2, 2, -3, 5, -1, 5, 5, -3, 6, 6, 5, 6$ is:
AnswerThe given data is $0, 2, 2, 2, -3, 5, -1, 5, 5, -3, 6, 6, 5$ and $6$.
Arranging the given data in ascending order, we have
$-3, -3, -1, 0, 2, 2, 2, 5, 5, 5, 5, 6, 6, 6$
Here, the number of observation $n = 14$, which is an even number.
Hence, the median is
$\frac{\Big(\frac{\text{n}}{2}\Big)^\text{th}\text{ observation }+{\Big(\frac{\text{n}}{2}+1\Big)}^\text{th}\text{ observation }}{2}$
$=\frac{\Big(\frac{14}{2}\Big)^\text{th}\text{ observation }+{\Big(\frac{14}{2}+1\Big)}^\text{th}\text{ observation }}{2}$
$=\frac{7^\text{th}\text{ observation }+8^\text{th}\text{ observation }}{2}$
$=\frac{2+5}{2}$
$=\frac{7}{2}$
$=3.5$
View full question & answer→MCQ 2051 Mark
What is the class Mark of the interval $15 - 20$?
AnswerCorrect option: B. $17.5$
Class mark is the mid-value of each class interval.
For class interval $15 - 20$.
Class mark $=\frac{15+20}{2}=\frac{35}{2}=17.5$
View full question & answer→MCQ 2061 Mark
AnswerWe know that, mode is the observation which occur maximum number of times.
View full question & answer→MCQ 2071 Mark
The mode of $4, 6, 7, 8, 12, 11, 13, 9, 13, 9, 7, 8, 9$ is:
AnswerIn statistics, the mode in a list of numbers refers to the integers that occur most number of times.
For the set of numbers, $9$ occurs three times i.e., more than any other number in the list.
View full question & answer→MCQ 2081 Mark
The mean of $100$ observations is $50$. If one of the observations which was $50$ is replaced by $150$, the resulting mean will be:
AnswerWe have, $\bar{\text{x}}=\frac{\sum\text{x}_\text{i}}{\text{n}}$
$\Rightarrow50=\frac{\sum\text{x}_\text{i}}{100}$
$\Rightarrow\sum\text{x}_\text{i}=50\times100=5,000$
If one of the observation which was 50 is resplaced by 150, then
$\sum\text{x}_\text{i}=5,000-50+150=5100$
Then, the resulting mean $=\frac{5100}{100}=51$
View full question & answer→MCQ 2091 Mark
The difference between the highest and lowest values of the observations is called:
AnswerThe difference between the highest and lowest value of observations is called 'Range' of observations.
View full question & answer→MCQ 2101 Mark
In a histogram, each class rectangle is constructed with base as:
AnswerIn a histogram, the class rectangles are constructed with base as the class−intervals.
View full question & answer→MCQ 2111 Mark
For which set of numbers do the mean, median and mode all have the same value?
- ✓
$1, 3, 3, 3, 5$
- B
$1, 1, 2, 5, 6$
- C
$1, 1, 1, 2, 5$
- D
$2, 2, 2, 2, 4$
AnswerCorrect option: A. $1, 3, 3, 3, 5$
For the data $2, 2, 2, 2, 4$ of $5$ numbers, we have
Mean $=\frac{2+2+2+2+4}{5}=\frac{12}{5}=2.4$
Median $=\Big(\frac{5+1}{2}\Big)^\text{th}$ Value $=$ $3rd$ Value $= 2$
Since, $2$ occurs maximum number of times, Mode $= 2$
Mean $\neq$ Median
For the data $1, 3, 3, 3, 5$ of $5$ numbers, we have
Mean $=\frac{1+3+3+3+5}{5}=\frac{15}{5}=3$
Median $=\Big(\frac{5+1}{2}\Big)^\text{th}$ Value $= 3^{rd}$ Value $= 3$
Since, $3$ occurs maximum number f times, Mode $= 3$
Mean $=$ Median $=$ Mode
View full question & answer→MCQ 2121 Mark
In a bar graph, $0.25\ cm$ length of a bar represents $100$ people. Then, the length of bar which represents $2000$ people is:
- ✓
$5\ cm$
- B
$3.5\ cm$
- C
$4\ cm$
- D
$4.5\ cm$
AnswerCorrect option: A. $5\ cm$
Use unitary method
$0.25\ cm - 100$ people
So $1\ cm - 400$ people
So for $2000$ people:
$\frac{2000}{400}=5\text{cm}$
View full question & answer→MCQ 2131 Mark
Write the correct answer in the following: The mean of five numbers is $30$. If one number is excluded, their mean becomes $28.$ The excluded number is:
AnswerLet $x_1, x_2, x_3, x_4$, and $x_5$ be five numbers and one of the excluded number be $x_5$,
Given, mean of the numbers $=30$
$\Rightarrow\frac{\text{x}_1+\text{x}_2+\text{x}_3+\text{x}_4+\text{x}_5}{5}=30$
$\Rightarrow {\text{x}_1+\text{x}_2+\text{x}_3+\text{x}_4+\text{x}_5}=150$
$\Rightarrow {\text{x}_1+\text{x}_2+\text{x}_3+\text{x}_4}=150-\text{x}_5$
On dividing both sides by 4, we get
$\frac{\text{x}_1+\text{x}_2+\text{x}_3+\text{x}_4}{4}=\frac{150-\text{x}_5}{4}\ \dots(\text{i})$
Given, mean of the numbers $= 28$
$\therefore\ \frac{150-\text{x}_5}{4}=28$ [from Eq. $(i)$]
$\Rightarrow 150 -\text{x}_5=112$
$\Rightarrow \text{x}_5=150 -112$
$\Rightarrow\text{x}_5=38$
Hence, the excluded number is $38$.
View full question & answer→MCQ 2141 Mark
In the class intervals $10-20, 20-30$ the number $20$ is included in:
AnswerCorrect option: C. $20-30.$
Since, $10-20, 20-30$ are Exclusive Class Intervals, the upper limit of a class is not included in the class.
Thus, $20$, will be taken in the class $20–30$.
View full question & answer→MCQ 2151 Mark
If the mean of the observations: $x, x + 3, x + 5, x + 7, x + 10$ is $9$, the mean of last three observations is:
- A
$11\frac{2}{3}$
- B
$10\frac{1}{3}$
- ✓
$11\frac{1}{3}$
- D
$10\frac{2}{3}$
AnswerCorrect option: C. $11\frac{1}{3}$
Given that:
$\frac{\text{x}+(\text{x+3})+(\text{x+5})+(\text{x+7})+(\text{x+10})}{5}=9$
$\frac{5\text{x}+25}{5}=9$
$5x + 25 = 45$
$5x = 20$
$x = 4$
So the last three numbers are $9, 11, 14$
So there mean is $11\frac{1}{3}$
View full question & answer→MCQ 2161 Mark
The median of the data arranged in ascending order $8, 9, 12, 18, (x + 2), (x + 4), 30, 31, 34, 39$, is $24$. The value of $x$ is:
AnswerThe data is given to be in an ascending order,
Here, $n = 10$, which is even
$\therefore\ $Median = mean of $\Big(\frac{10}{2}\Big)^\text{th}$ and $\Big(\frac{10}{2}+1\Big)^\text{th}$ term
$=$ mean of $5^{th}$ and $6^{th}$ terms
$= \frac{1}{2}\Big[(\text{x}+2)+(\text{x}+4)\Big]$
$=\frac{1}{2}\big[2\text{x}+6\big]$
But median $= 24$
$\Rightarrow\frac{1}{2}\big[2\text{x}+6\big]=24$
$\Rightarrow2\text{x}+6=48$
$\Rightarrow2\text{x}=42$
$\Rightarrow\text{x}=21$
View full question & answer→MCQ 2171 Mark
The mean of n observations is $\overline{\text{X}}$ If each observation is multiplied by $k$, the mean of new observations is:
- A
$\overline{\text{X}}+\text{k}$
- B
$\overline{\text{X}}-\text{k}$
- C
$\frac{\overline{\text{X}}}{\text{k}}$
- ✓
$\text{k}\overline{\text{X}}$
AnswerCorrect option: D. $\text{k}\overline{\text{X}}$
Let us take n observations $X_1, \ldots, X_n$
If $\overline{\text{X}}$ be the mean of the n observations then we have
$\overline{\text{X}}=\frac{1}{\text{n}}\sum_{\text{i}=1}^{\text{n}}\text{X}_{\text{i}}$
$\Rightarrow\sum_{\text{i}=1}^{\text{n}}\text{X}_{\text{i}}=\text{n}\overline{\text{X}}$
Multiply a constant k to each of the observations then observations becomes $kXi . \ldots \ldots kX_{N}$
If $\overline{\text{Y}}$ be the mean of the new observations, then we have
$\overline{\text{Y}}=\frac{1}{\text{n}}\sum_{\text{i}=1}^{\text{n}}\text{kX}_{\text{i}}$
$=\frac{\text{k}}{\text{n}}\sum_{\text{i}=1}^{\text{n}}\text{X}_{\text{i}}$
$={\text{k}}\cdot=\frac{1}{\text{n}}\sum_{\text{i}=1}^{\text{n}}\text{X}_{\text{i}}$
$=\text{k}\overline{\text{X}}$
View full question & answer→MCQ 2181 Mark
Write the correct answer in the following: In a frequency distribution, the mid value of a class is $10$ and the width of the class is. The lower limit of the class is:
AnswerLet $x$ and $y$ be the uppel and lower and lower class limit in a frequency distribution.
Now, mid value of a class $\frac{(\text{x}+\text{y})}{2}=10$ [given]
$\Rightarrow x + y = 20 ...(i)$
Also, given that, width of class$ x - y = 6 ...(ii)$
On adding Eqs. $(i)$ and $(ii)$, we get
$2x = 20 + 6$
$\Rightarrow 2x = 26$
$\Rightarrow x = 13$
On putting $x = 13$ in Eq. $(i)$, we get
$13 + y = 20$
$\Rightarrow y = 7$
Hence, the lower limit of the class is $7$.
View full question & answer→MCQ 2191 Mark
Class size of a distribution having $28, 34, 40, 46$ and $52$ as its class marks is:
AnswerClass size is the difference between two consecutive values of the class mark.
Here, the difference between two consecutive class mark is $6$
i.e., $34 - 28 = 6$
View full question & answer→MCQ 2201 Mark
The mean of first n natural numbers is:
AnswerCorrect option: D. $\frac{\text{n}+1}{2}$
The mean is equal to the sum of all the values in the data set divided by the number of values in the
data set. Sum of first n natural numbers is $\frac{\text{n}(\text{n}+1)}{2}$
So, mean of first n natural numbers is $\frac{\frac{\text{n}(\text{n}+1)}{2}}{\text{n}}=\frac{(\text{n}+1)}{2}$
View full question & answer→MCQ 2211 Mark
A student collects information about the number of school going children in a locality consisting of a hundred households. The data collected by him is:
AnswerData obtained through the information collected by the investigator herself or himself with defininte objective in his/ her mind is called as primary data.
View full question & answer→MCQ 2221 Mark
Let m be the mid-point and I be the upper-class limit of a class in a continuous frequency distribution. The lower class limit of the class is:
- A
$2m + I$
- B
$m - I$
- C
$2I - m$
- ✓
$2m - I$
AnswerCorrect option: D. $2m - I$
Let the lower limit $= k$
Midpoint $= m$
Upper limit $= I$
$\text{Mid-point}=\frac{\text{(Upper limit + lower limit)}}{2}$
$\text{m}=\frac{\text{(K + I)}}{2}$
$2\text{m}=\text{k + I}$
$\text{k}=\text{2m - I}$
Therefore, lower limit $= 2m - I$
View full question & answer→MCQ 2231 Mark
What is the mid - points of class interval $12.3 - 22.3$?
- A
$15.3$
- B
$16.3$
- ✓
$17.3$
- D
$18.3$
AnswerCorrect option: C. $17.3$
Average of upper limit &lower limit of a class interval is called its mid point.
For the class interval $12.3 - 22.3$
$\text{Mid - point }=\frac{12.3+22.3}{2}$
$\text{Midpoint is }:17.3$
View full question & answer→MCQ 2241 Mark
In a frequency distribution, ogives are graphical representation of:
AnswerIn a frequency distribution, ogives are graphical representation of cumulative frequency.
View full question & answer→MCQ 2251 Mark
If $\bar{\text{x}}_1, \bar{\text{x}}_2, \bar{\text{x}}_3, ....., \bar{\text{x}}_\text{n}$ are the means of n group with n$n _1, n _2, \ldots, nn$ number of observations respectively, then the mean $\bar{\text{x}}$ of all the groups taken together is given by:
- A
$\sum\limits^\text{n}_{\text{i}=1}$
- B
$\frac{\sum\limits^\text{n}_{\text{i}=1}\text{n}_\text{i}\bar{\text{x}}_\text{i}}{\text{n}^2}$
- ✓
$\frac{\sum\limits^\text{n}_{\text{i}=1}\text{n}_\text{i}\bar{\text{x}}_\text{i}}{\text{n}_2}$
- D
$\frac{\sum\limits^\text{n}_{\text{i}=1}\text{n}_\text{i}\bar{\text{x}}_\text{i}}{2\text{n}}$
AnswerCorrect option: C. $\frac{\sum\limits^\text{n}_{\text{i}=1}\text{n}_\text{i}\bar{\text{x}}_\text{i}}{\text{n}_2}$
If $\bar{\text{x}}_1, \bar{\text{x}}_2, \bar{\text{x}}_3, ....., \bar{\text{x}}_\text{n}$ are the mean of n group with $n _1, n _2, \ldots, nn$ number of observation respectively, then the mean $\bar{\text{x}}$
$\bar{\text{x}}=\frac{\text{n}_1\bar{\text{x}}_1+\text{n}_2\bar{\text{x}}_2+\text{n}_3\bar{\text{x}}_3+\ ....\ +\text{n}_\text{n}\bar{\text{x}}_\text{n}}{\text{n}_1+\text{n}_2+\text{n}_3+\ ....\ +\text{n}_\text{n}}$
$=\frac{\sum\limits^\text{n}_{\text{i}=1}\text{n}_\text{i}\bar{\text{x}}_\text{i}}{\sum\limits^\text{n}_{\text{i}=1}\text{n}_\text{i}}$
Hence, the mean $\bar{\text{x}}$ of all group taken together is gien up $=\frac{\sum\limits^\text{n}_{\text{i}=1}\text{n}_\text{i}\bar{\text{x}}_\text{i}}{\sum\limits^\text{n}_{\text{i}=1}\text{n}_\text{i}}$
View full question & answer→MCQ 2261 Mark
The empirical relation between mean, mode and median is:
- ✓
Mode = $3$ Median - $2$ Mean
- B
Mode = $3$ Median + $2$ Mean
- C
Mode = $3$ Mean - $2$ Median
- D
Mode = $2$ Median - $3$ Mean
AnswerCorrect option: A. Mode = $3$ Median - $2$ Mean
For frequency distribution: mean, mode & median connected by the relation
Mean - mode = $3$(mean - median)
Thus,
Mode $= 3$ median - $2$ mean
View full question & answer→MCQ 2271 Mark
The runs scored by $11$ members of a cricket term are: $15, 34, 56, 27, 43, 29, 31, 13, 50, 20, 0$. The median score is
AnswerArranging the points in an ascending order,
We have:
$0, 13, 15, 20, 27, 29, 31, 34, 43, 50, 56,$
Here, $n = 11$, Which is odd
$\therefore\ $median score = value of $=\frac{1}{2}(11+1)^\text{th}$ term
$=$ value of $\Big(\frac{1}{2}\times12\Big)^\text{th}$ term
$=$ value of $6^{th}$ term
$= 29$
View full question & answer→MCQ 2281 Mark
When the data consists of $3, 4, 5, 4, 3, 4, 5,$ which statement is true?
AnswerThe mean is equal to the sum of all the values in the data set divided by the number of values in the data set.
Mean of the given data is $(3 + 3 + 4 + 4 + 4 + 5 + 5) ÷ 7 = 4.$
The mode in a list of numbers refers to the integers that occur most number of times.
So the mode is also $4$.
Hence mean = mode
View full question & answer→MCQ 2291 Mark
The mean of the following data is $8$.
|
x
|
$3$
|
$5$
|
$7$
|
$9$
|
$11$
|
$13$
|
|
y
|
$6$
|
$8$
|
$15$
|
$p$
|
$8$
|
$4$
|
Then, the value of p is: Answer
|
x
|
y
|
x × y
|
|
$3$
|
$6$
|
$18$
|
|
$5$
|
$8$
|
$40$
|
|
$7$
|
$15$
|
$105$
|
|
$9$
|
$p$
|
$9p$
|
|
$11$
|
$8$
|
$88$
|
|
$13$
|
$4$
|
$52$
|
|
Total
|
$41 + p$
|
$303 + 9p$
|
Now,
Mean $=\frac{303+9\text{p}}{41+\text{p}}$
Given,
Mean $= 8$
$\therefore\frac{303+9\text{p}}{41+\text{p}}=8$
$\Rightarrow 303 + 9p = 328 + 8p$
$\Rightarrow p = 25$ View full question & answer→MCQ 2301 Mark
To represent the less than type graphically, we plot the ________ on the $x$-axis.
AnswerTo represent ‘the less than type’ graphically, we plot the upper limits on the $x$-axis. e.g. marks obtained by students are represented in grouped data as $(0-10), (10-20), (20-30), (30-40) ...$ only upper limits such as $10, 20, 30, 40 ...$ are taken for the $x$-axis
View full question & answer→MCQ 2311 Mark
A grouped frequency table with class intervals of equal size using $3-5$ ($5$ included in this interval) as one of the class intervals is constructed for the following data. The frequency of the class $3-5$ is:
|
$1$
|
$4$
|
$7$
|
$2$
|
$0$
|
$3$
|
$9$
|
$2$
|
$3$
|
$7$
|
$6$
|
$3$
|
$5$
|
|
$2$
|
$5$
|
$5$
|
$6$
|
$2$
|
$3$
|
$5$
|
$1$
|
$0$
|
$4$
|
$6$
|
$4$
|
$6$
|
AnswerCount all the numbers in the frequency table between $3$ to $5$.
Frequency of the numbers from $3$ to $5$ is $11$.
View full question & answer→MCQ 2321 Mark
If the mean of $x$ and $\frac{1}{\text{x}}$ is $M$, then the mean of $x^2$ and $\frac{1}{\text{x}^2}$ is:
- A
$2 M-1$
- B
$2 M+1$
- C
$2 M^2+1$
- ✓
$2 M^2-1$
AnswerCorrect option: D. $2 M^2-1$
Given ,$\frac{\text{x}+\frac{1}{\text{x}}}{2}=\text{M}$
Taking square on both sides
$\bigg(\frac{\text{x}+\frac{1}{\text{x}}}{2}\bigg)^2=(\text{M})^2$
$\bigg(\text{x}+{\frac{1}{\text{x}}}\bigg)^2=(2\text{M})^2$
$\bigg(\text{x}^2+2+{\frac{1}{\text{x}^2}}\bigg)=(2\text{M})^2$
$\bigg(\text{x}^2+{\frac{1}{\text{x}}}\bigg)^2={4\text{M}^2-2}$
Divide by $2$ on both sides to get mean
$\bigg(\frac{\text{x}^2+\frac{1}{\text{x}^2}}{2}\bigg)^2=2\text{M}^2-1$
View full question & answer→MCQ 2331 Mark
The width of each of the five continuous classes in a frequency distribution is $5$ and the lower class limit of the lowest class is $10$. The upper class limit of the highest class is:
AnswerLower class limit $=10$
Width of each class $=5$
Width till the upper class limit for a frequency distribution having $5$ classes $=5\times 5=25$
View full question & answer→MCQ 2341 Mark
Median of a data is given by:
- ✓
$\text{l}+\bigg(\frac{\frac{\text{n}}{2}-\text{cf}}{\text{f}}\bigg)\times{\text{h}}$
- B
$\text{l}+\bigg(\frac{\frac{\text{n}}{2}-\text{f}}{\text{cf}}\bigg)\times{\text{h}}$
- C
$\text{l}-\bigg(\frac{\frac{\text{n}}{2}-\text{cf}}{\text{f}}\bigg)\times{\text{h}}$
- D
$\text{l}+\bigg(\frac{\frac{\text{n}}{2}-\text{cf}}{\text{f}}\bigg)\div{\text{h}}$
AnswerCorrect option: A. $\text{l}+\bigg(\frac{\frac{\text{n}}{2}-\text{cf}}{\text{f}}\bigg)\times{\text{h}}$
Where, $l$ = lower limit of the median class
$F$ = frequency of the median class
$CF$ = cumulative frequency of the class preceding the median class
$N$ = number of observations
$H$ = size of the class interval (assuming all class sizes to be equal)
View full question & answer→MCQ 2351 Mark
In a bar graph, $0.25\ cm$ length of a bar represents $100$ people. Then, the length of bar which represents $2000$ people is:
- A
$4.5\ cm$
- B
$4\ cm$
- ✓
$5\ cm$
- D
$3.5\ cm$
AnswerCorrect option: C. $5\ cm$
Use unitary method
$0.25\ cm - 100$ people
So $1\ cm - 400$ people
So for $2000$ people:
$\frac{2000}{400}=5\text{cm}$
View full question & answer→MCQ 2361 Mark
To analyse the election results, the data is collected from a newspapers. The data thus collected is known as:
AnswerSecondary data is the readily available data collected by someone else & published in newspapers or journals etc.
View full question & answer→MCQ 2371 Mark
For which set of data does the median equal the mode?
- ✓
$3, 3, 4$
- B
$3, 4, 5, 6, 6$
- C
$3, 3, 4, 5, 6$
- D
$3, 3, 4, 5$
AnswerCorrect option: A. $3, 3, 4$
The median is the middle score for a set of data that has been arranged in ascending or descending order of magnitude.
Mode in a list of numbers refers to the integers that occurs most number of times.
For the above list of observations.
Both median and mode is $3$.
View full question & answer→MCQ 2381 Mark
For which set of numbers do the mean, median and mode all have the same value?
- A
$2, 2, 2, 2, 4$
- ✓
$1, 3, 3, 3, 5$
- C
$1, 1, 2, 5, 6$
- D
$1, 1, 1, 2, 5$
AnswerCorrect option: B. $1, 3, 3, 3, 5$
|
|
Mean
|
Median
|
Mode
|
|
$2, 2, 2, 2, 4$
|
$\frac{12}{5}=2.4$
|
$2$
|
$2$
|
|
$1, 3, 3, 3, 5$
|
$\frac{15}{5}=3$
|
$3$
|
$3$
|
|
$1, 1, 2, 5, 6$
|
$\frac{15}{5}=3$
|
$2$
|
$1$
|
|
$1, 1, 1, 2, 5$
|
$\frac{10}{5}=2$
|
$1$
|
$1$
|
From above table, data $1, 3, 3, 3, 5$ has mean, median, mode all have same value, i.e. $3$ View full question & answer→MCQ 2391 Mark
The mean weight of six boys in a group is $48\ kg$. The individual weights of five of them are $51\ kg, 45\ kg, 49\ kg, 46\ kg$ and $44\ kg$. The weight of the $6th$ boy is:
- A
$52\ kg$
- B
$52.8\ kg$
- ✓
$53\ kg$
- D
$47\ kg$
AnswerCorrect option: C. $53\ kg$
Mean weight of six boys $= 48\ kg$
Let the weight of the $6th$ boy be $x\ kg$.
We know:
Mean $=\frac{\text{Sum of all observations}}{\text{Total Number of observations}}$
$=\frac{51+45+49+46+44+\text{x}}{6}$
$=\frac{235+\text{x}}{6}$
Given,
Mean $= 48\ kg$
$=\frac{235+\text{x}}{6}=48$
$\Rightarrow235+\text{x}=288$
Hence, the weight of the $6th$ boy is $53\ kg$.
View full question & answer→MCQ 2401 Mark
Which one of the following is not the graphical representation of statistical data:
- A
- B
- C
- ✓
Cumulative frequency distribution.
AnswerCorrect option: D. Cumulative frequency distribution.
We know that bar graph, histogram and frequency polygons are all graphical representation of statistical data.
View full question & answer→MCQ 2411 Mark
The average of three consecutive even integers is $20$. Then, the integers are:
- A
$20, 22, 24$
- ✓
$18, 20, 22$
- C
$14, 16, 18$
- D
$16, 18, 20$
AnswerCorrect option: B. $18, 20, 22$
Let the three consecutive even integers be$- x, x + 2, x + 4$
$\frac{\text{x}+\text{x}+2\text{x}+4}{3}=20$
$\frac{3\text{x}+6}{3}=20$
$3\text{x}+6=60$
$3\text{x}=54$
$\text{x}=18$
So the three numbers are $18, 20, 22$.
View full question & answer→MCQ 2421 Mark
Which one of the following is not the graphical representation of statistical data?
- ✓
Cumulative frequency distribution.
- B
- C
- D
AnswerCorrect option: A. Cumulative frequency distribution.
Technically, a cumulative frequency distribution is the sum of the class and all classes below it in a frequency distribution.
View full question & answer→MCQ 2431 Mark
For a given data, the difference between the maximum and minimum observation is known as its:
AnswerDifference between maximum and minimum value of observation is called as range.
View full question & answer→MCQ 2441 Mark
The mean of $25$ observations is $36$. Out of these observations if the mean of first $13$ observations is $32$ and that of the last $13$ observations is $40$, the $13\ th$ observation is:
AnswerGiven, Mean of $25$ observations $= 36$
$\therefore$ Sum of $25$ observations $= 36 \times 25 = 900$
Now, the mean of first $13$ observations $= 32$
$\therefore$ Sum of first $13$ observations $= 13 \times 32 = 416$
and the Mean of last $13$ observations $= 40$
$\therefore$ Sum of last $13$ observations $= 40 \times 13 = 520$
So, $13\ th$ observation = (Sum of last $13$ observations + Sum of first $13$ observations) - (Sum of $25$ observations)
$= (520 + 416) - 900 = 936 - 900 = 36$
Hence, the $13\ th$ observation is $36$.
View full question & answer→MCQ 2451 Mark
The mean of $a, b, c, d$ and $e$ is $28$. If the mean of $a, c,$ and $e$ is $24$, what is the mean of $b$ and $d$?
AnswerGiven that the mean of $a, b, c, d$ and $e$ is $28$. They are $5$ in numbers.
Hence, we have
$\frac{\text{a}+\text{b}+\text{c}+\text{d}+\text{e}}{5}=28$
$\Rightarrow\frac{(\text{a}+\text{c}+\text{e})+(\text{b}+\text{d})}{5}=28$
$\Rightarrow\frac{(\text{a}+\text{c}+\text{e})}{5}+\frac{(\text{b}+\text{d})}{5}=28$
But, it is given that the mean of $a, c$ and $e$ is $24$. Hence, we have
$\Rightarrow\frac{(\text{a}+\text{c}+\text{e})}{5}=24$
$\Rightarrow\text{a}+\text{c}+\text{e}=72$
Then We have
$\frac{72}{5}+\frac{(\text{b}+\text{d})}{5}=28$
$\Rightarrow\frac{\text{b}+\text{d}}{5}=28-\frac{72}{5}$
$\Rightarrow\frac{\text{b}+\text{d}}{5}=28-14.4$
$\Rightarrow\frac{\text{b}+\text{d}}{5}=13.6$
$\Rightarrow\text{b}+\text{d}=68$
$\Rightarrow\frac{\text{b}+\text{d}}{2}=\frac{68}{2}$
$\Rightarrow\frac{\text{b}+\text{d}}{2}=34$
Hence, the mean of $b$ and $d$ is $34$.
View full question & answer→MCQ 2461 Mark
A student collects information about the number of schools going children in a locality consisting of a hundred households. The data collected by him is:
AnswerData obtained through the information collected by the investigator herself or himself with defininte objective in his/ her mind is called as primary data.
View full question & answer→MCQ 2471 Mark
'More than' cumulative frequency table for a given data is as follows: Then, the frequency of the class interval $70-80$ is:
|
|
More than
|
More than
|
More than
|
|
|
Marks
|
$89$
|
$79$
|
$69$
|
More than $59$
|
|
Cumulative frequency
|
$8$
|
$18$
|
$30$
|
$65$
|
AnswerA cumulative frequency distribution is the sum of the class and all classes below it in a frequency distribution.
Subtract cumulative frequency of class more than $70$ from the next cumulative Frequency of class more than $69$.
$30 - 18 = 12$.
View full question & answer→MCQ 2481 Mark
Tally marks are used to find:
AnswerWhen observations are large, it may not be easy to find the frequencies by simple counting.
So, we make use of tally marks.
Thus, Tally marks are used to find frequency.
View full question & answer→MCQ 2491 Mark
The weight of $10$ students (in kg) are: $55, 40, 35, 60, 38, 36, 45, 31, 44$. The median weight is:
- A
$40kg.$
- B
$41kg.$
- ✓
$42kg.$
- D
$44kg.$
AnswerCorrect option: C. $42kg.$
Arranging the points in an ascending order,
We have:
$31, 35, 36, 38, 40, 44, 45, 52, 55, 60$
Here, $n = 10$, Which is even
$\therefore\ $median = mean of $\Big(\frac{10}{2}\Big)^\text{th}$ and $\Big(\frac{10}{2}+1\Big)^\text{th}$ terms
$=$ mean of $\Big(\frac{10}{2}\Big)^\text{th}$ and $\Big(\frac{12}{2}\Big)^\text{th}$ term
$=$ mean of $5^{th}$ and $6^{th}$ term
$=\frac{1}{2}(40+44)$
$=\frac{1}{2}\times84$
$=42\text{kg}$
View full question & answer→MCQ 2501 Mark
The mid-value of a class interval is $42$. If the class size is $10$, then the upper and lower limits of the class are:
- ✓
$47$ and $37$
- B
$37$ and $47$
- C
$37.5$ and $47.5$
- D
$47.5$ and $37.5$
AnswerCorrect option: A. $47$ and $37$
Let $l$ and $m$ respectively be the lower and upper limits of the class.
Then the mid-value of the class is $\frac{\text{l+m}}{2}$ and the class-size is $(l - m)$.
Given that the mid-value of the class is $42$ and the class-size is $10$.
Therefore, we have two equations
$\frac{\text{l+m}}{2}=42$
$\Rightarrow l + m = 84,$
$m - l = 10$
Adding the above two equations, we have
$(l + m) + (m - l) = 84 + 10$
$\Rightarrow l + m + m - l = 94$
$\Rightarrow 2m = 94$
$\Rightarrow l = 37$
Substituting the value of $m$ in the first equation, we have
$l + 47 = 84$
$\Rightarrow l = 84 - 47$
$\Rightarrow l = 37$
Hence, the upper and lower limits of the class are $47$ and $37$ respectively.
Thus, the correct choice is $(a)$.
View full question & answer→MCQ 2511 Mark
Which one of the following is not a measure of central value?
AnswerWe know that mean, median and mode are all measures of central tendency.
View full question & answer→MCQ 2521 Mark
$\text{Mode}+\frac{3}{2}(\text{Median - Mode})=$
Answer$3$ Median = $2$ Mean + Mode
$\Rightarrow 3$ Median – Mode = $2$ Mean
$\Rightarrow\text{Mean}=\frac{3}{2}\text{ Median }-\frac{\text{Mode}}{2}$
$\Rightarrow\text{Mean}+\frac{3}{2}\text{ Median }-\frac{\text{Mode}}{2}-\text{Mode = Mean}$
$\Rightarrow\text{Mean}+\frac{3}{2}\text{(Median - }\text{Mode) = Mean}$
View full question & answer→MCQ 2531 Mark
The minimum value of a data is $82$ and range is $38$, then the maximum value is:
AnswerThe difference between the maximum and minimum value of the observation is called a range.
Let the maximum value be $x$.
So,
$x - 82 = 38$
$x = 82 + 38$
$x = 120$
View full question & answer→MCQ 2541 Mark
The mean of the below frequency distribution is $3.5$, then the value of $x$ is:
|
Varible
|
$1$
|
$2$
|
$x$
|
$4$
|
$5$
|
|
Frequency
|
$2$
|
$3$
|
$4$
|
$5$
|
$6$
|
AnswerFrom the given frequency distribution table:
$3.5=\frac{2\times1+3\times2+4\text{x}+5\times4+6\times5}{2+3+4+5+6}$
$3.5=\frac{2+6+4\text{x}+20+30}{20}$
$70 + 4x + 58$
$4x = 12$
$x = 3$
View full question & answer→MCQ 2551 Mark
In the given graph, the number of students who scored $60$ or more marks is:
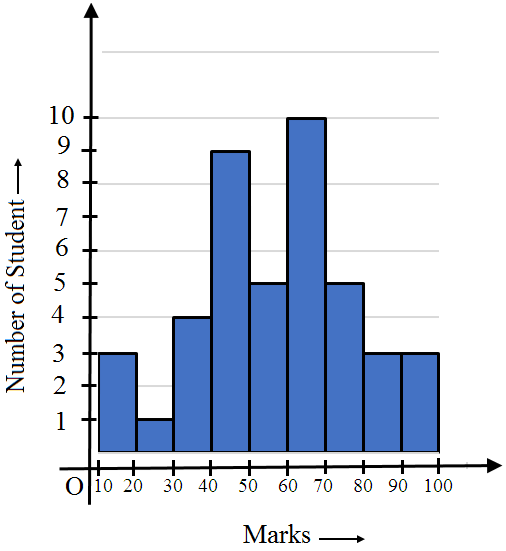
AnswerAdd the values corresponding to the height of the bar from $60$ to $100$
$10 + 5 + 3 + 3 = 21$
View full question & answer→MCQ 2561 Mark
The class mark of the class interval $2.4-6.6$ is:
AnswerClass mark $=\frac{\text{uppar limit+lower limit}}{2}$
$=\frac{2.4+6.6}{2}$
$=\frac{9}{2}$
View full question & answer→MCQ 2571 Mark
The mean of the marks scored by $50$ students was found to be $39$. Later on it was discovered that a score of $43$ was misread as $23$. The correct mean is:
- ✓
$39.4$
- B
$39.8$
- C
$39.2$
- D
$38.6$
AnswerCorrect option: A. $39.4$
Mean of the marks scored by $50$ students $= 39$
Sum of the marks scored by $50$ students $= (39 \times 50) = 1950$
Correct sum $= (1950 + 43 - 23) = 1970$
$\therefore$ Mean $= 19750 = 39.4$
View full question & answer→