Question 15 Marks
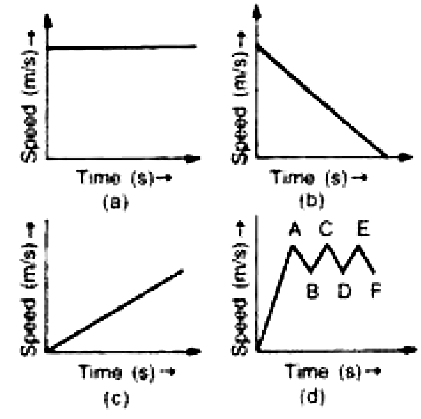
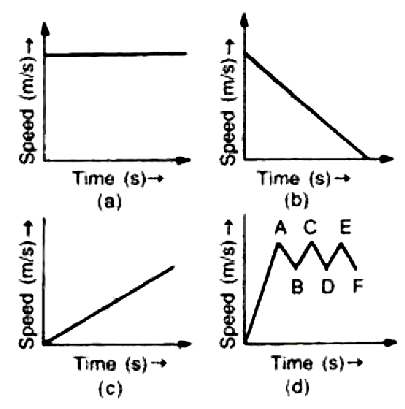
(i) In speed time graph uniform motion is given by a straight line parallel to x axis so figure (a) denotes the uniform motion.
(ii) In speed time graph motion with increasing speed is shown by straight line with positive slope so figure (c) denotes the motion with speed increasing.
(iii) In speed time graph motion with decreasing speed is shown by straight line with negative slope so figure (b) denotes the motion with speed decreasing.
(iv) In speed time graph motion with oscillating speed is shown by zigzag line so figure {d) denotes the motion with speed oscillating.
Answer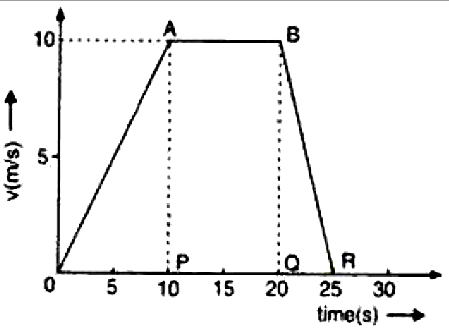
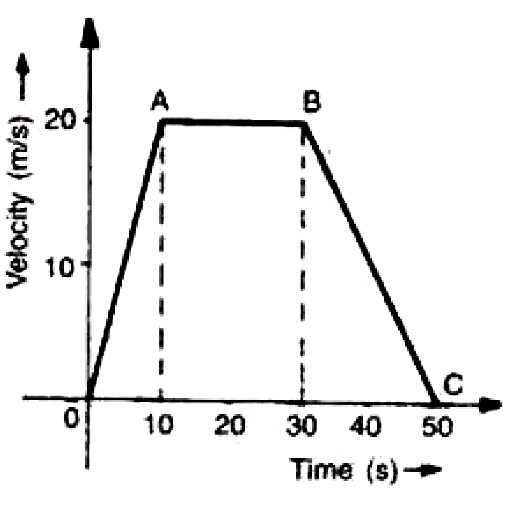
As we know that acceleration is given by the slope of the velocity-time graph so we have to calculate the slope of the graph of each stage of motion,
Acceleration during $O$ to $P=(10-0) /(10-0)=1 ms^{-2}$
Acceleration during $P$ to $Q=(10-10) /(20-10)=0 ms^{-2}$
Acceleration during $Q$ to $R=(0-10) /(25-20)=-2 ms^{-2}$
View full question & answer→As we know that acceleration is given by the slope of the velocity-time graph so we have to calculate the slope of the graph of each stage of motion,
Acceleration during $O$ to $P=(10-0) /(10-0)=1 ms^{-2}$
Acceleration during $P$ to $Q=(10-10) /(20-10)=0 ms^{-2}$
Acceleration during $Q$ to $R=(0-10) /(25-20)=-2 ms^{-2}$