What happens to the level of national income when aggregate demand falls short of aggregate supply?
Download our app for free and get started
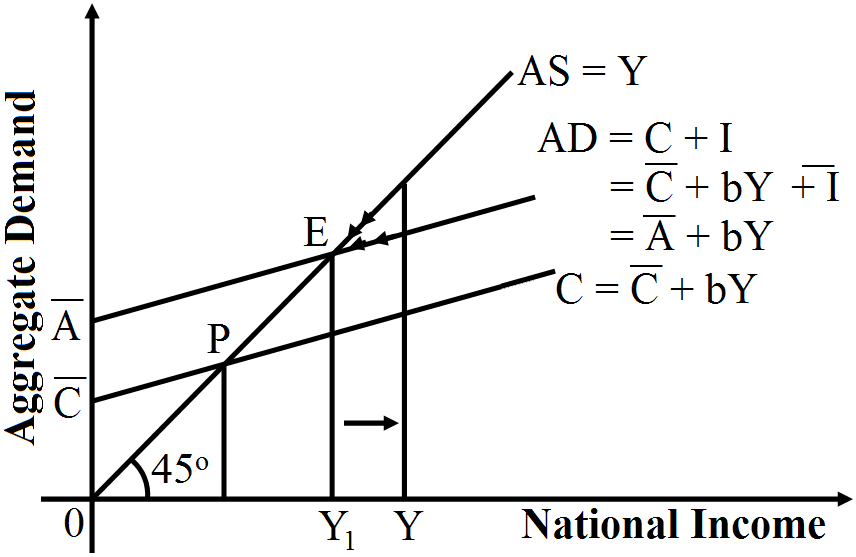
- In keynesian theory, economy will be in equilibrium when aggregate demand represented by (C + I) curve is equal total output (Aggregate Supply).
- In the above mentioned figure, at point P, income = consumption, which is known as to be a break - even point. The equilibrium level of national income is attained at point E, where aggregate demand = aggregate supply.
- If, due to some disturbance, we divert from our position like, i. When Aggregate Demand is less than Aggregate Supply:
- At any greater level of output, (C + I) line lies below 45° line that is, planned spending is less than planned output.
- This means that consumers and firm together would be buying less goods than firms were producing.
- This would lead to an unplanned, undesired increase in Inventories of unsold Goods. Firms would then respond to this unplanned inventory increase by decreasing employment and hence output.
- This process of decrease in output will continue until economy is back at point E, when Aggregate Demand is equal to Aggregate Supply.

Download our appand get started for free
Experience the future of education. Simply download our apps or reach out to us for more information. Let's shape the future of learning together!No signup needed.*
Similar Questions
- 1View SolutionExplain the working of investment multiplier with the help of an example.
- 2View SolutionWhat is investment multiplier? Explain its working using a suitable numerical example.
- 3View SolutionIf Marginal Propensity to Consume is 0.9, what is the value of multiplier? How much investment is needed to increase National Income by ₹ 5,000 crore? Calculate.
- 4View SolutionExplain the meaning of investment multiplier. What can be its minimum and maximum value and why?
- 5View SolutionExplain the meaning of inflationary gap. Explain any two measures of correcting it.
OR
Explain and graphically represent the concept of inflationary gap. Explain any one measure of removing this gap. - 6View SolutionAn economy is in equilibrium. From the following data about an economy, calculate investment expenditure:
- Income = 10000
- Marginal propensity to consume = 0.9
- Autonomous consumption = 100
- 7View SolutionExplain the national income determination in an economy using saving and investment approach. Use diagram.
- 8View SolutionDistinguish between average propensity to consume and average propensity to save. What is the relation between the two?
- 9View SolutionAn economy is in equilibrium. From the following data, calculate the marginal propensity to save:
- Income = 10,000
- Autonomous consumption = 500
- Consumption expenditure = 8,000
- 10View SolutionExplain the meaning of deflationary gap with the help of a diagram.
OR
Explain with the help of a diagram the concept of deficient demand in macroeconomics.