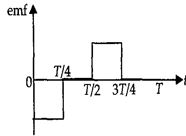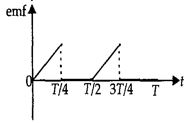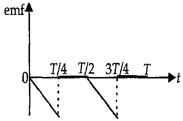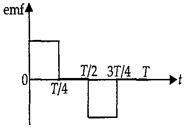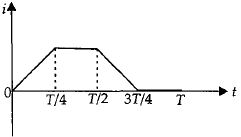
Induced \(emf\), \(e=-L \frac{a_{l}}{d t}\)
For \(0 \leq t \leq \frac{T}{4}\)
\(i-t\) graph is a straight line with positive constant slope.
\(\therefore \quad \frac{d i}{d t}=\) constant
\(\Rightarrow e=-v e \text { and constant } \)
\( \text { For } 0 \leq t \leq \frac{T}{4}\)
For \(\frac{T}{4} \leq t \leq \frac{T}{2}\)
\(i\) is constant \(\therefore \frac{d i}{d t}=0\)
\(\Rightarrow \quad e=0\)
For \(\frac{T}{4} \leq t \leq \frac{T}{2}\)
For \(\frac{T}{2} \leq t \leq \frac{3 T}{4}\)
\(i-t\) graph is a straight line with negative constant slope.
\(\therefore \frac{d i}{d t}=\) constant
\(\Rightarrow e=+\) \(ve\) and constant
For \(\frac{T}{2} \leq t \leq \frac{3 T}{4}\)
For \(\frac{3 T}{4} \leq t \leq T\)
\(i\) is zero \(\therefore \frac{d i}{d t}=0\)
\(\Rightarrow e=0 \quad \text { For } \frac{3 T}{4} \leq t \leq T\)
From this analysis, the variation of induced \(emf\) with time as shown in the figure below.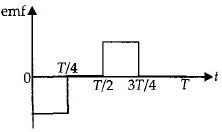
Download our appand get started for free
Similar Questions
- 1$L$ લંબાઇની બાજુવાળો અને $R$ અવરોધ ધરાવતી ચોરસ લૂપ સમાન ચુંબકીયક્ષેત્રમાં $v$ વેગથી ગતિ કરે છે,તો કેટલો પ્રવાહ ઉત્પન્ન થાય?View Solution

- 2જ્યારે $R$ ત્રિજ્યાની નાની વર્તુળાકાર લૂપને $L$ પરિમાણના મોટા ચોરસ લૂપમાં મૂકવામાં આવે $(L \gg R)$ તો આ પ્રકારની ગોઠવણી માટે અન્યોન્ય પ્રેરણનું મૂલ્ય શોધો.View Solution

- 3$n$ આંટાવાળી અને $A$ ક્ષેત્રફળવાળી કોઇલની અક્ષ ચુંબકીયક્ષેત્રને સમાંતર છે,હવે તેને $180^o$ નું ભ્રમણ આપવાથી ઉદ્ભવતો વિદ્યુતભાર $Q$ છે.પરિપથનો અવરોધ $R$ હોય,તો ચુંબકીયક્ષેત્ર કેટલું થાય?View Solution
- 4View Solutionટ્રાન્સફોર્મરનો કોર લેમીનેટેડ કરવાથી...
- 5પૃથ્વીના $3 × 10^{-4} \,T$ ચુંબકીયક્ષેત્રમાં સમક્ષિતિજ ધટક અને ડીપ એન્ગલ ${\tan ^{ - 1}}\left( {\frac{4}{3}} \right)$ છે, $0.25 \,m$ લંબાઇનો સળિયો ઉત્તર દક્ષિણ રાખીને $10 \,cm/s$ ના વેગથી પૂર્વ દિશામાં ગતિ કરાવતાં કેટલા ......$ \mu V $ $emf$ ઉત્પન્ન થાય?View Solution
- 6એક વિસ્તારમાં ચુંબકીય ક્ષેત્ર $\overrightarrow{ B }= B _{0}\left(\frac{ x }{ a }\right) \,\hat{ k }$ વડે અપાય છે. $d$ બાજુ ધરાવતાં એક ચોરસ ગાળાને તેની બાજુઓ $x$ અને $y$ અક્ષ પર રહે તેમ મૂકવામાં આવે છે. ગાળાને અચળ વેગ $\overrightarrow{ v }= v _{0} \hat{ i }$ થી ગતિ કરાવવામાં આવે છે. ગાળામાં પ્રેરિત $emf$ ....... હશે.View Solution
- 7$10 \mathrm{~cm}$ બાજુ અને $0.7 \Omega$ અવરોધની એક ચોરસ લૂપને પૂર્વ-પશ્રિમ સમતલમાં શિરોલંબ રાખેલી છે.$0.20$$T$ મૂલ્યના સમાન ચુંબકીય ક્ષેત્રને ઉત્તર-પૂર્વ દિશામાંના સમતલમાં રાખેલ છે. ચુંબકીય ક્ષેત્ર $1 S$ માં સ્થિર દરે ધટીને શૂન્ય થાય છે. તો પ્રેરિત emf નું મૂલ્ય $\sqrt{x} \times 10^{-3} V$ છે. તો $x$ નું મૂલ્ય________છે.View Solution
- 8$N$ આંટા , $A$ ક્ષેત્રફળ અને $R$ અવરોધ ધરાવતાં કોઇલ ચુંબકીયક્ષેત્ર $B$ માં $\omega$ કોણીય ઝડપથી ભ્રમણ કરે તો જનરેટરમાં ઉદભવતા મહતમ $e.m.f. = ........$View Solution
- 9ઈન્ડક્ટરને સ્વીચથી $DC$ વૉલ્ટેજ સપ્લાય સાથે જોડતા હવે,View Solution
- 10View Solutionસમબાજુ ત્રિકોણ ધરાવતા એક લાકડાના ચોખઠા પર , તાંબાના તારને વીંટાળવામાં આવે છે. હવે જો આ ચોખઠાની દરેક બાજુનું રેખીય પરીમાણ, ચોખઠાની એકમ લંબાઈ દીઠ ગુંચળાના આંટાની સંખ્યા અચળ રાખી, ત્રણ ગણું વધારવામાં આવે તો ગુંચળાનું આત્મપ્રેરણ કેટલું થાય?
